Mike Saxton – Manager of Ecological Restoration and Land Stewardship – Shaw Nature Reserve – Gray Summit, MO
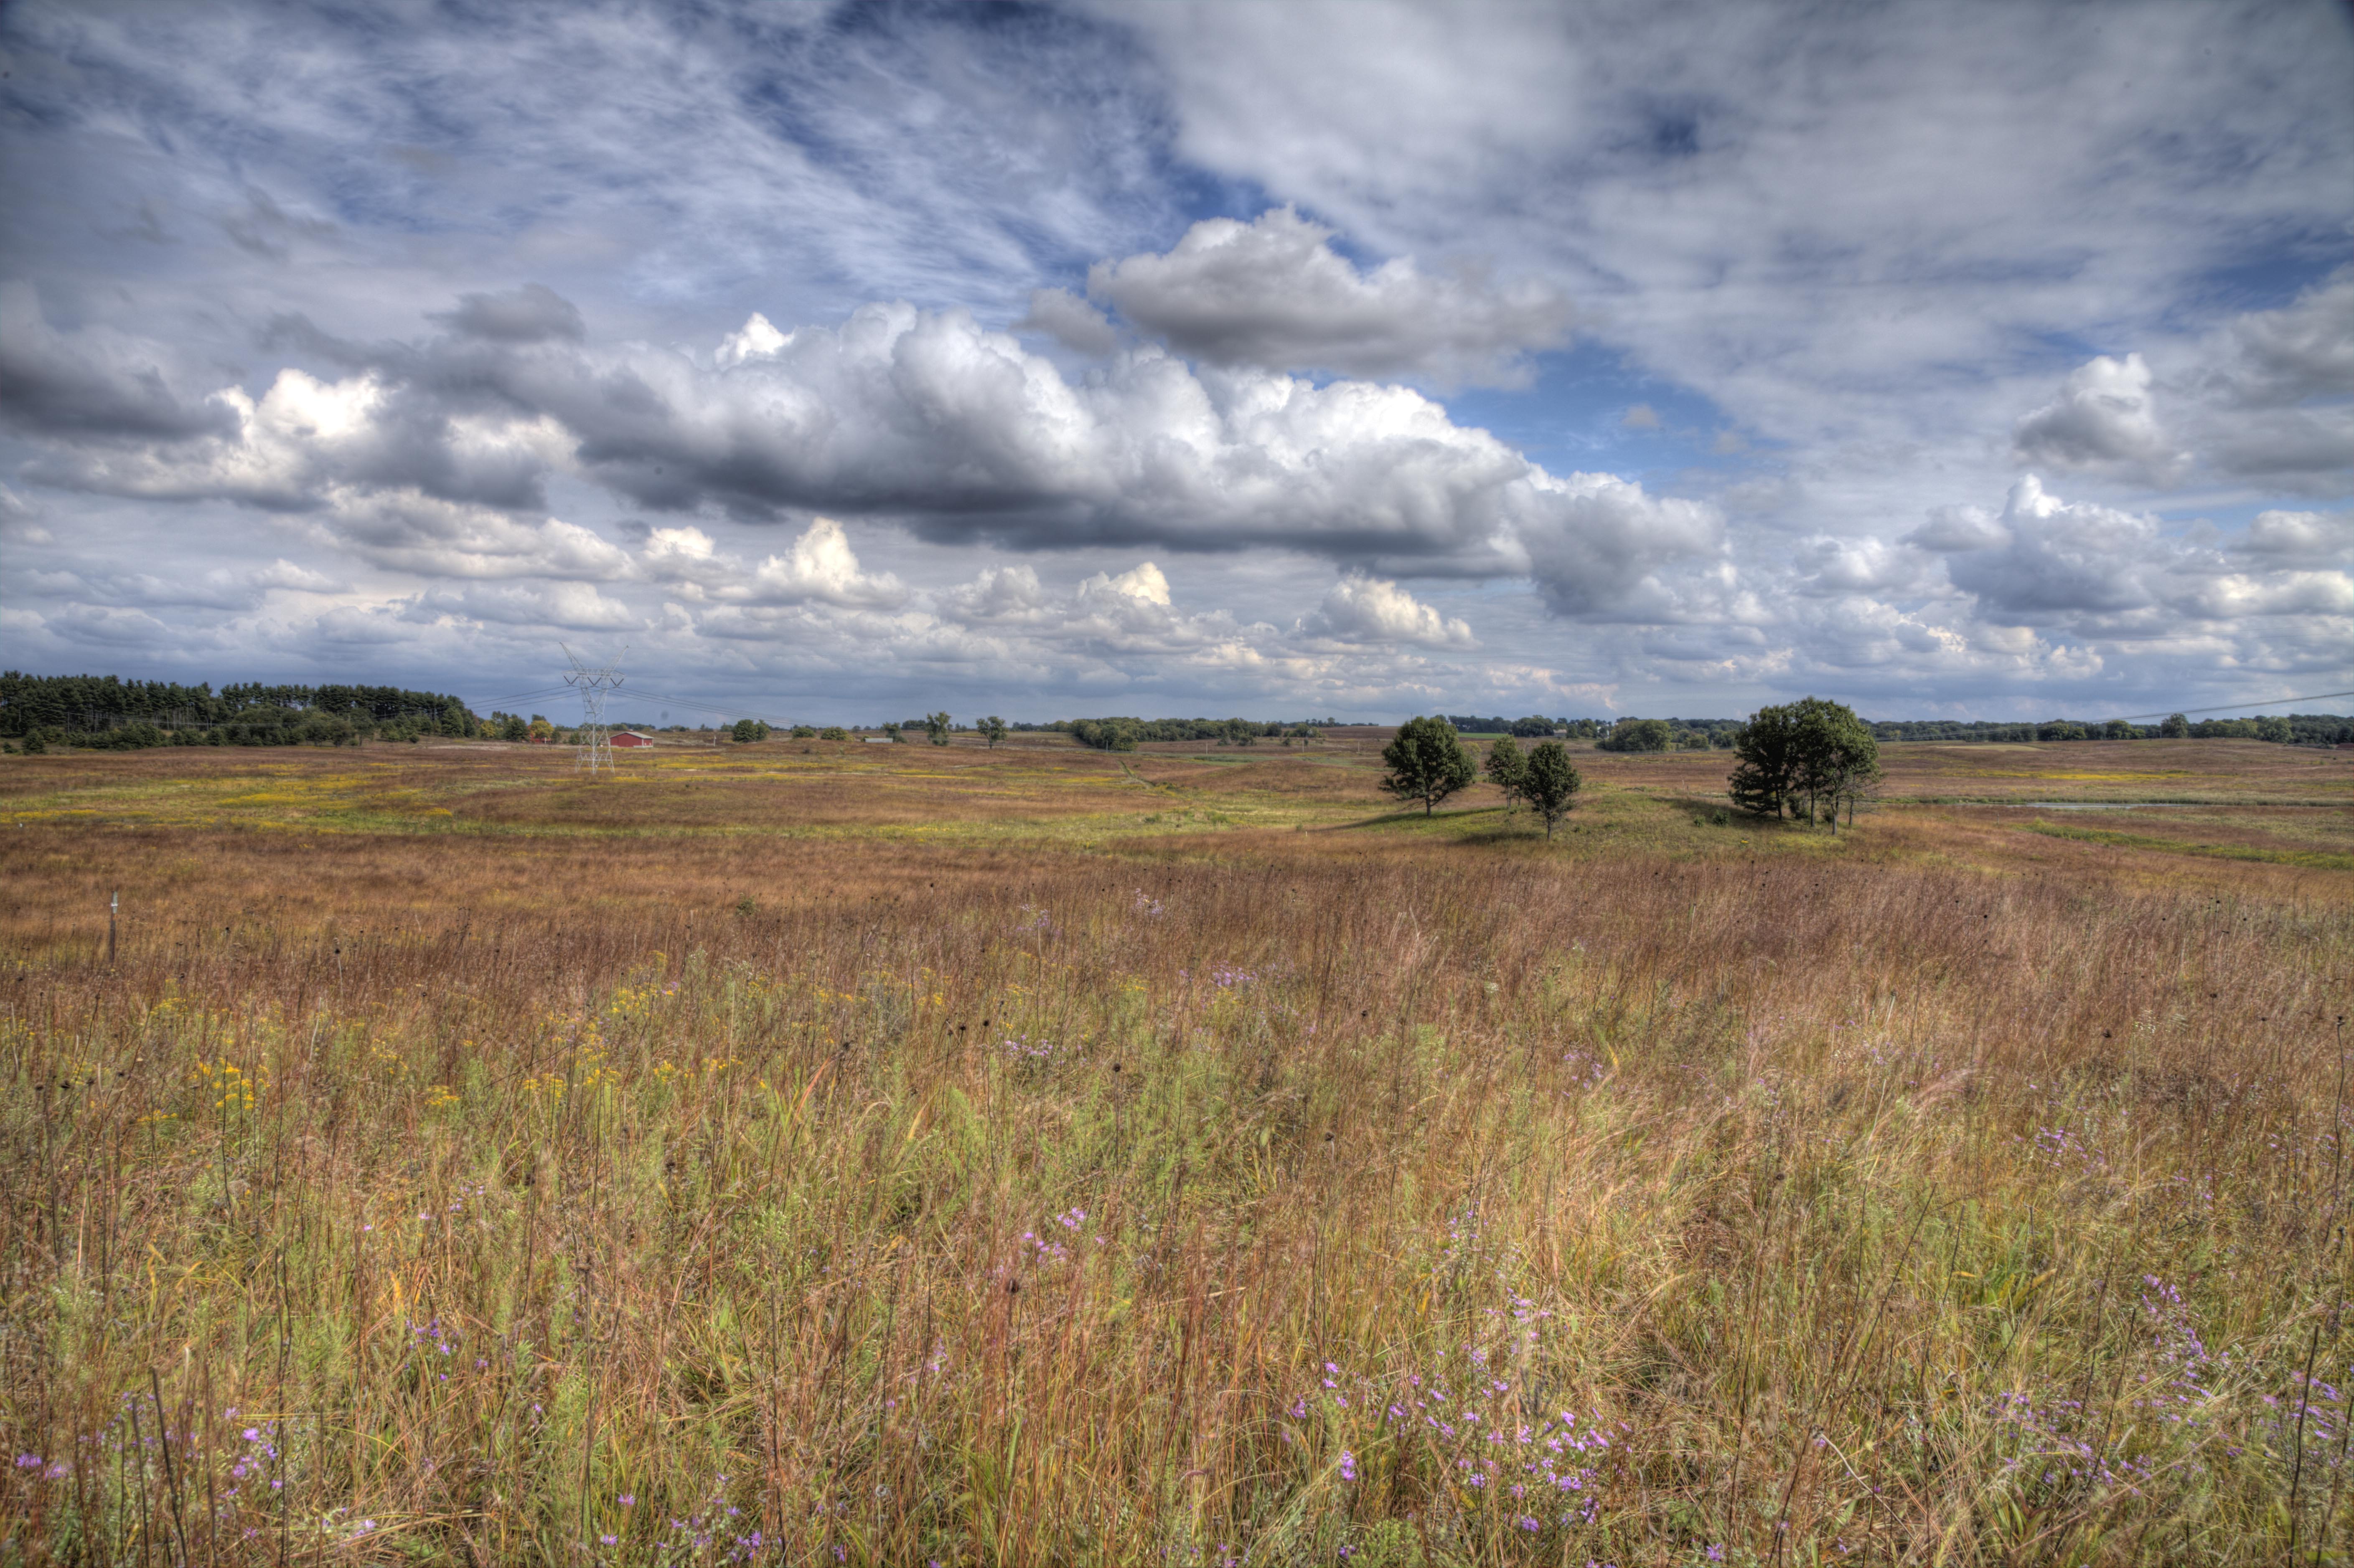
Over the course of ecological time, large portions of the Midwest have been a shifting mosaic of prairie, savanna and open woodlands. 500 wet years might have meant less fire on the landscape, which allowed trees to establish in new places and in greater abundance. 500 dry years might have pushed the gradient in the other direction with more intensive fire limiting the establishment and persistence of trees in a prevailingly grass dominated ecotone.
In their seminal paper The Demise of Fire and “Mesophication” of Forests in the Eastern United States, Nowacki and Abrams described how the demise of fire has led to “a cascade of compositional and structural changes whereby open lands (grasslands, savannas, and woodlands) succeeded to closed-canopy forests, followed by the eventual replacement of fire-dependent plants by shade-tolerant, fire-sensitive vegetation.”
We can’t burn our way out of a century of tree establishment in our formerly open and sun-lit natural communities. This is where hack and squirt can be a fast and effective treatment. In areas where you have large diameter oaks and hickories, thousands of small maples, virtually no oak-recruitment, and a bare, sun-starved woodland floor, this can be a great approach.

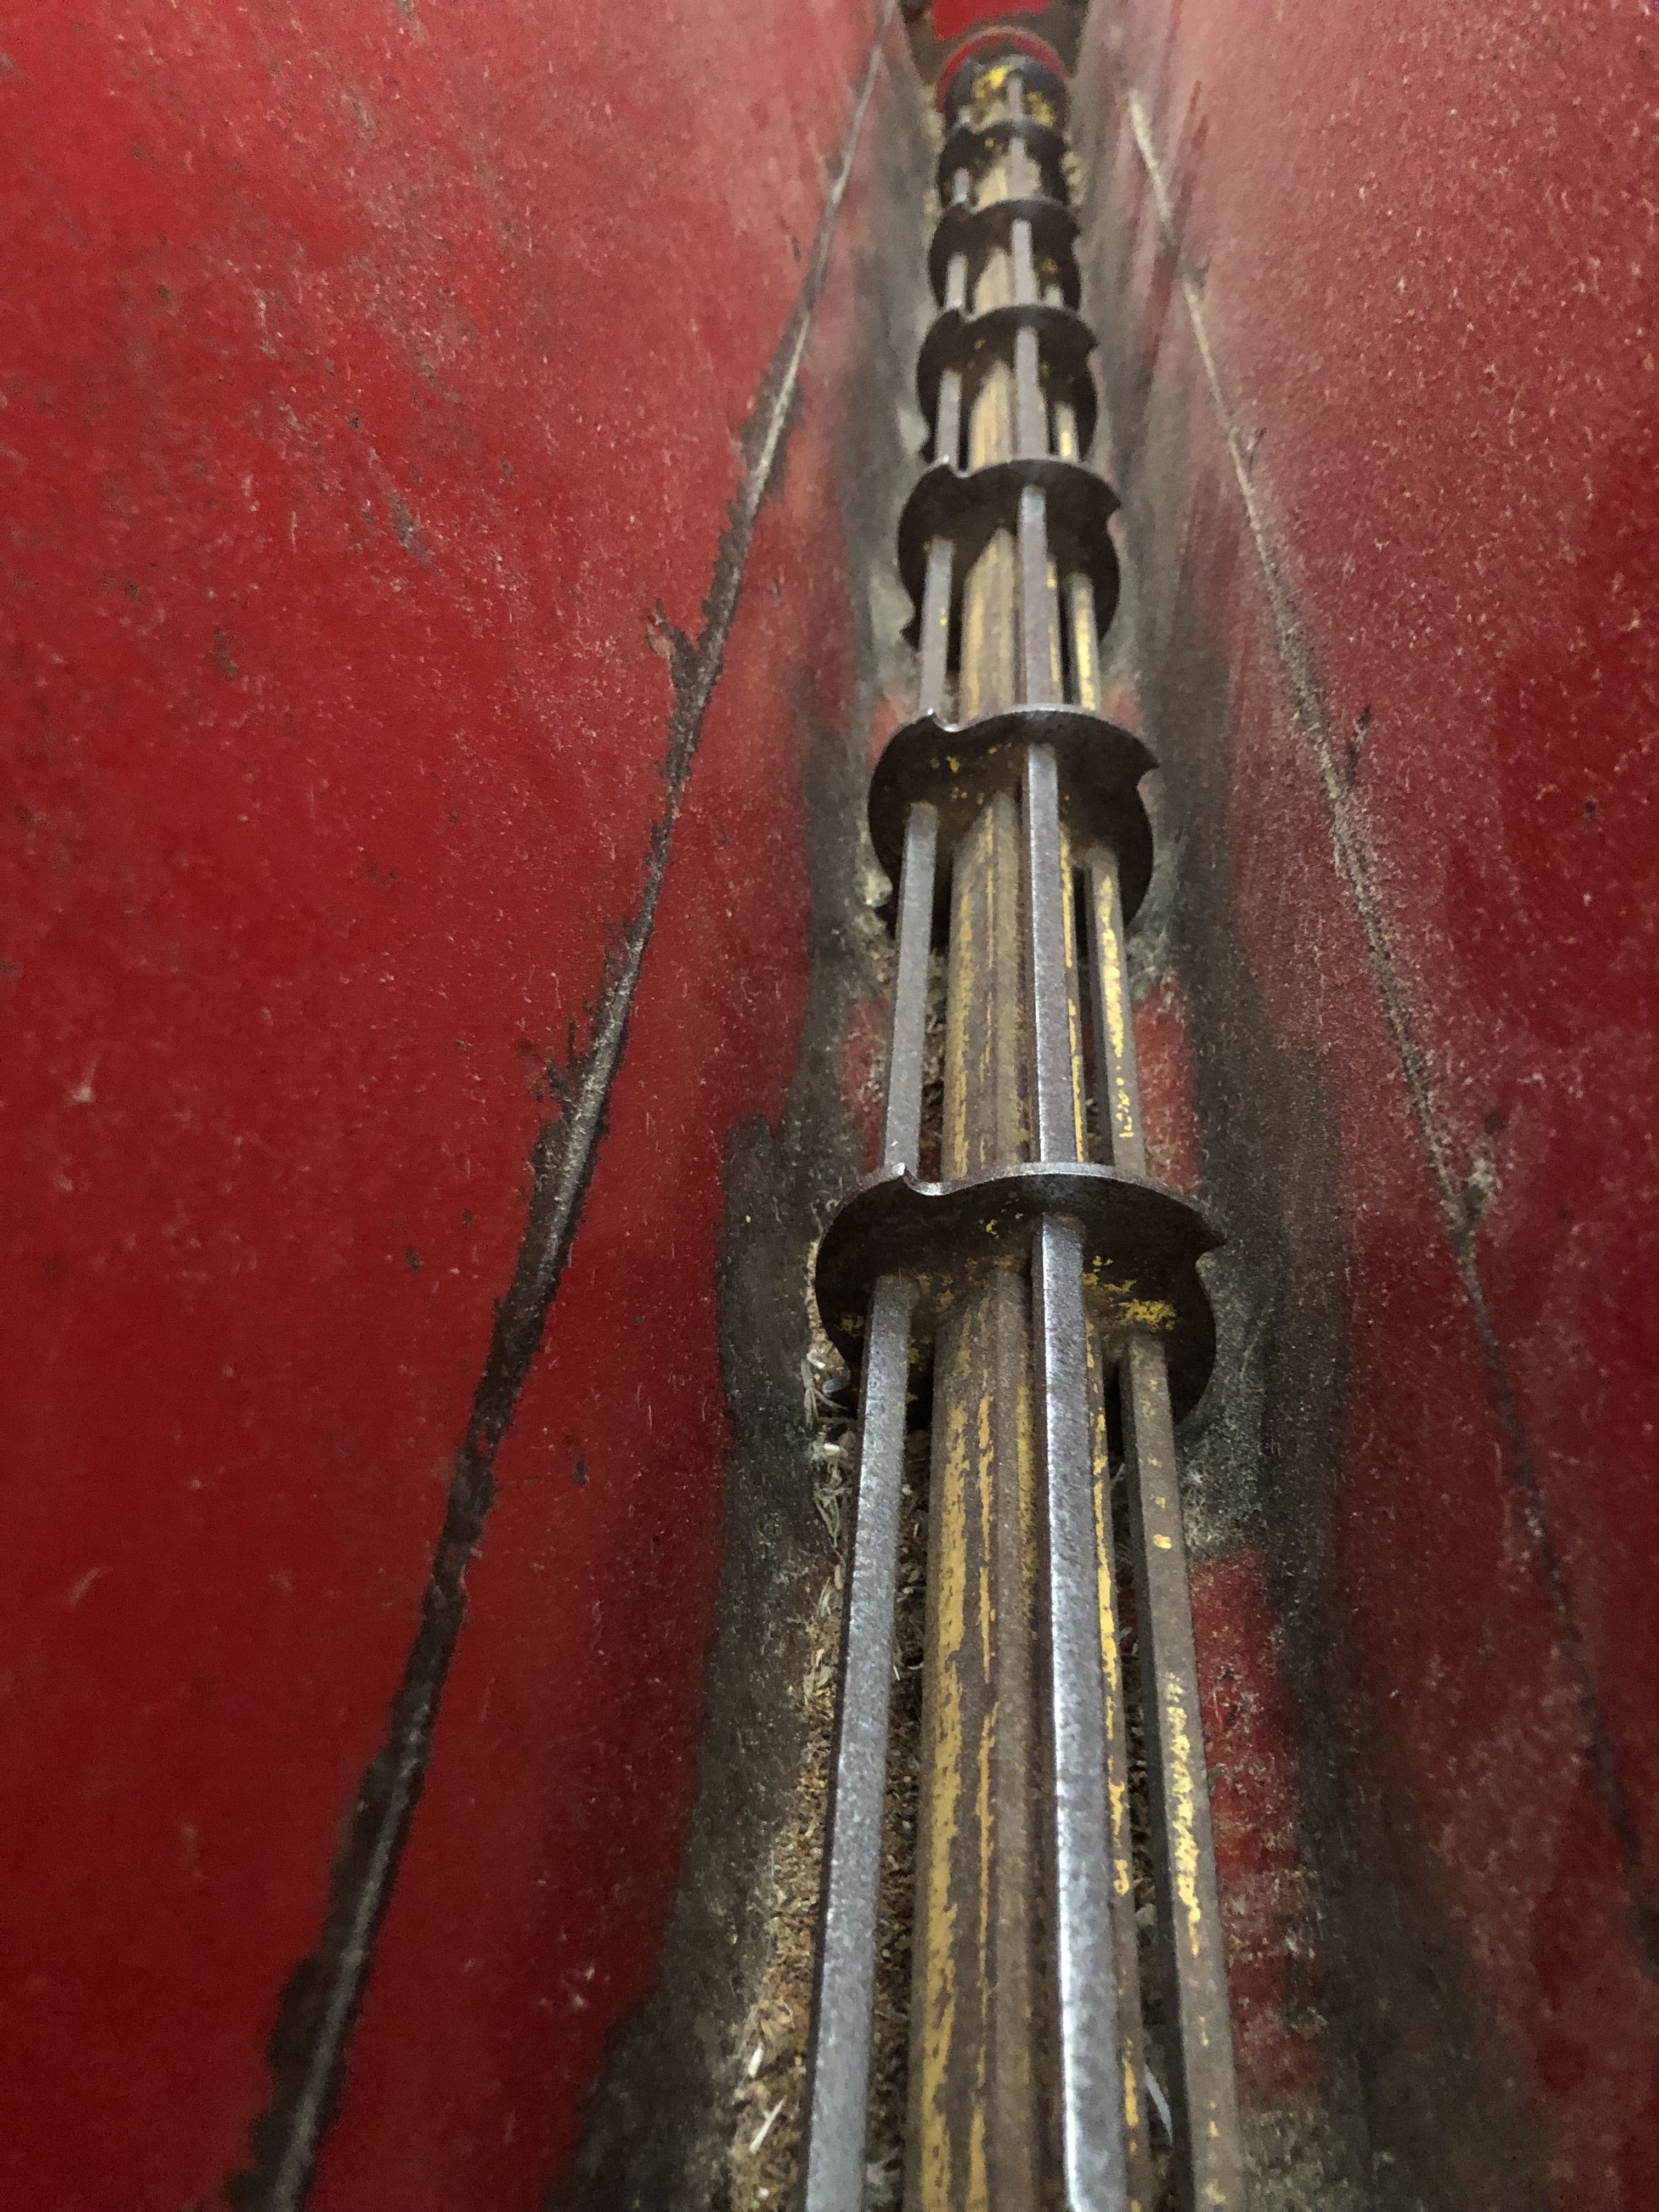
We like to use the Fiskars hatchet with the fiberglass handle. The 2-liter Solo hand sprayer works well. The smaller squeeze bottle runs out of herbicide too soon. We do our treatments in the dormant season, usually starting in November and going until February. We use JLB basal oil and triclopyr ester (Garlon 4, Remedy, Element). Typically, we mix in bulk with 12.5G of oil mixed with 2.5G of herbicide.

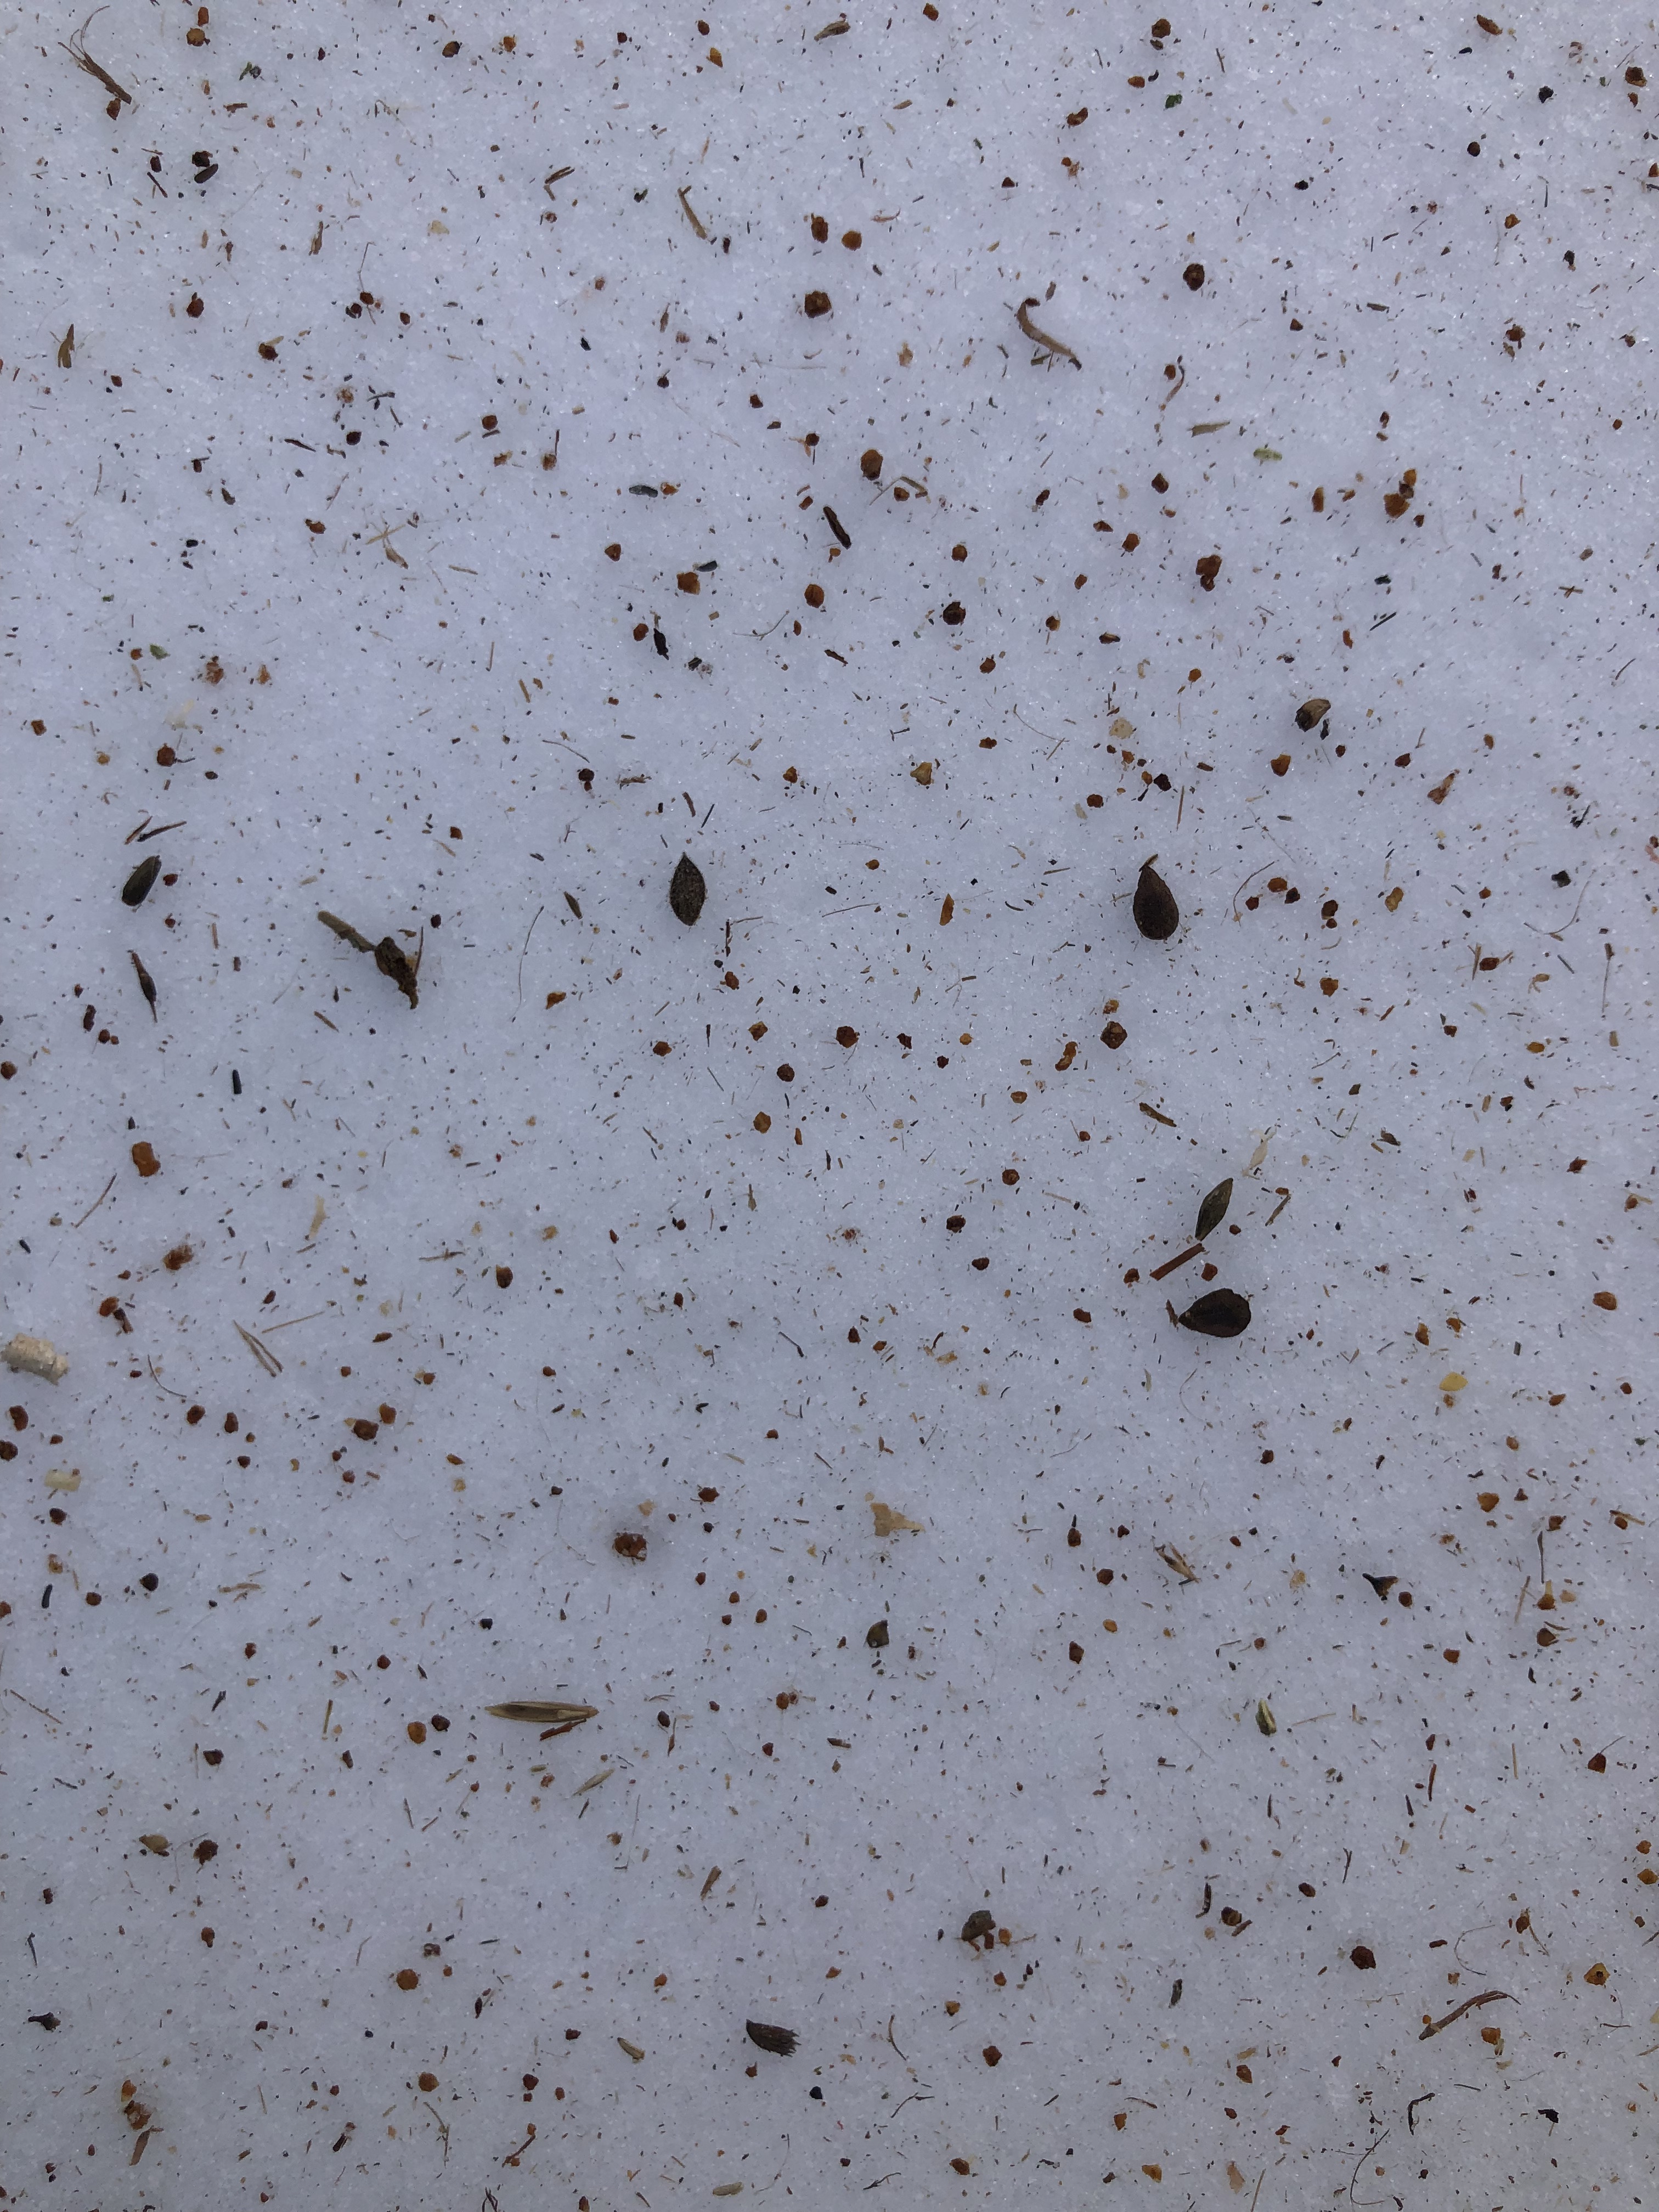
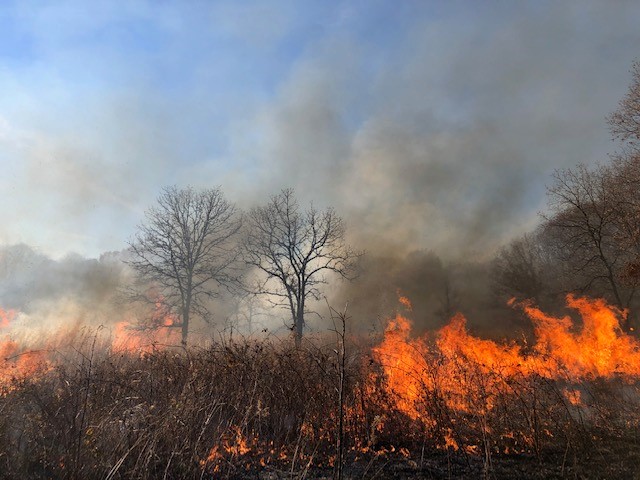
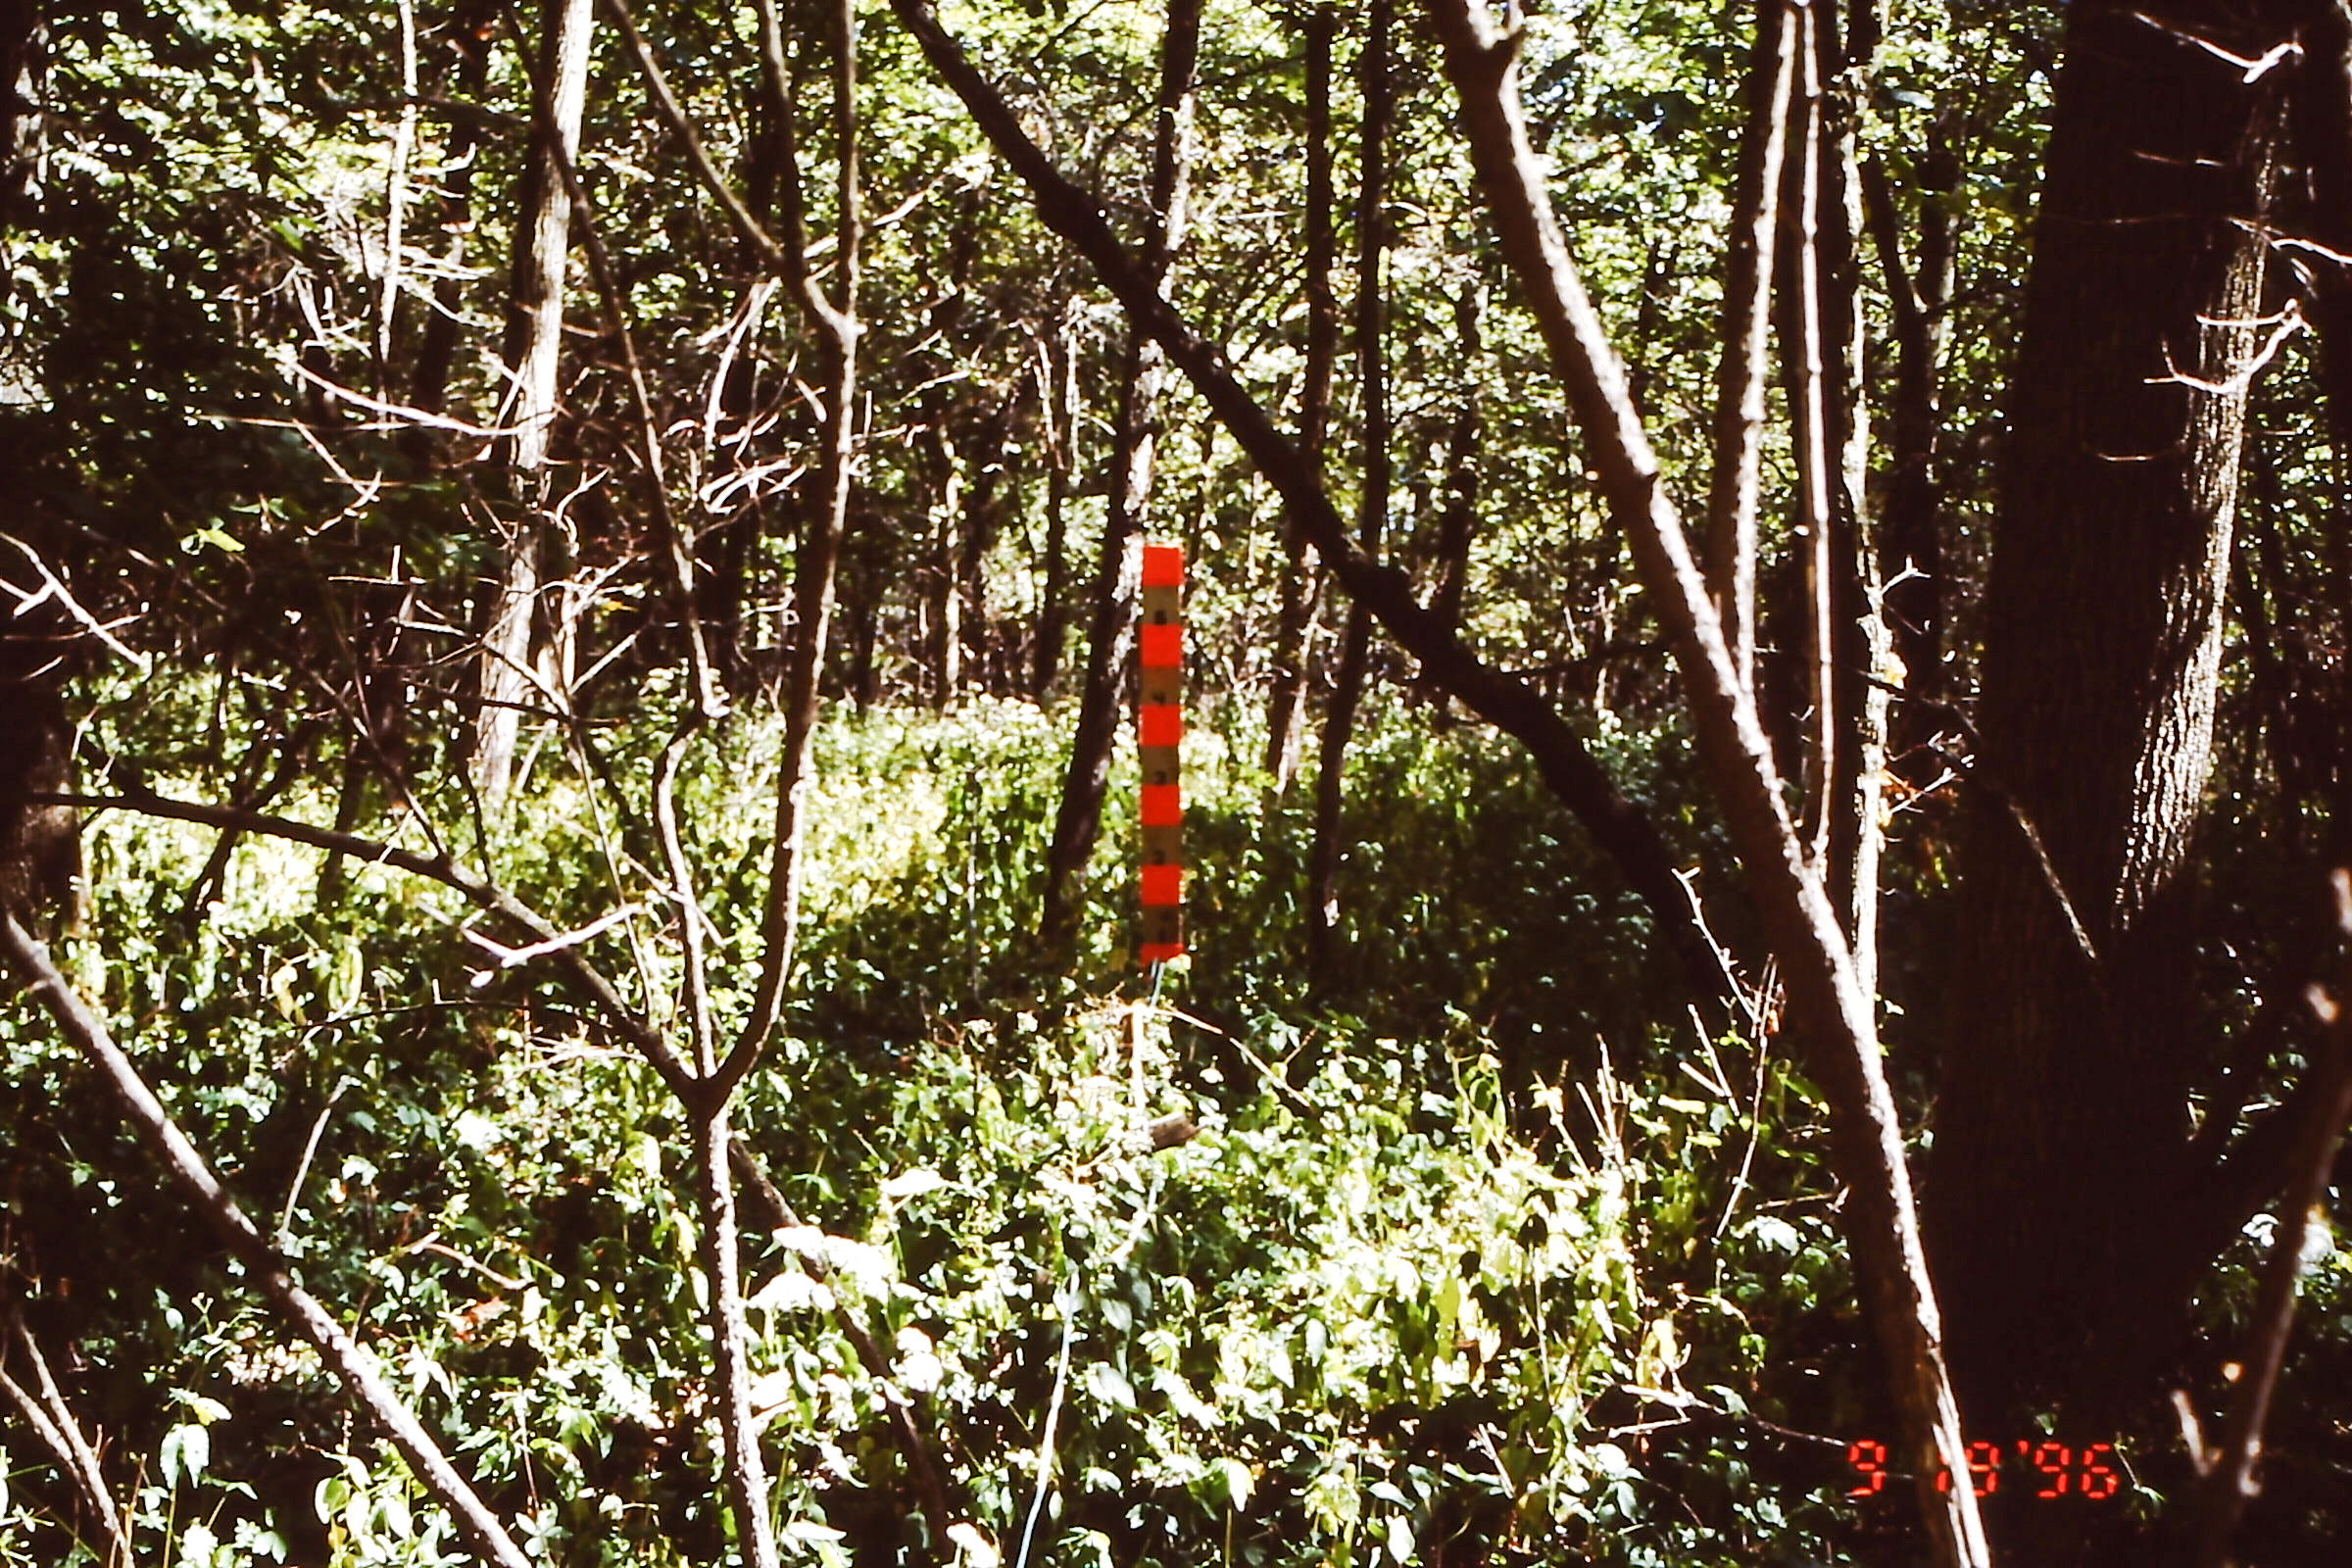
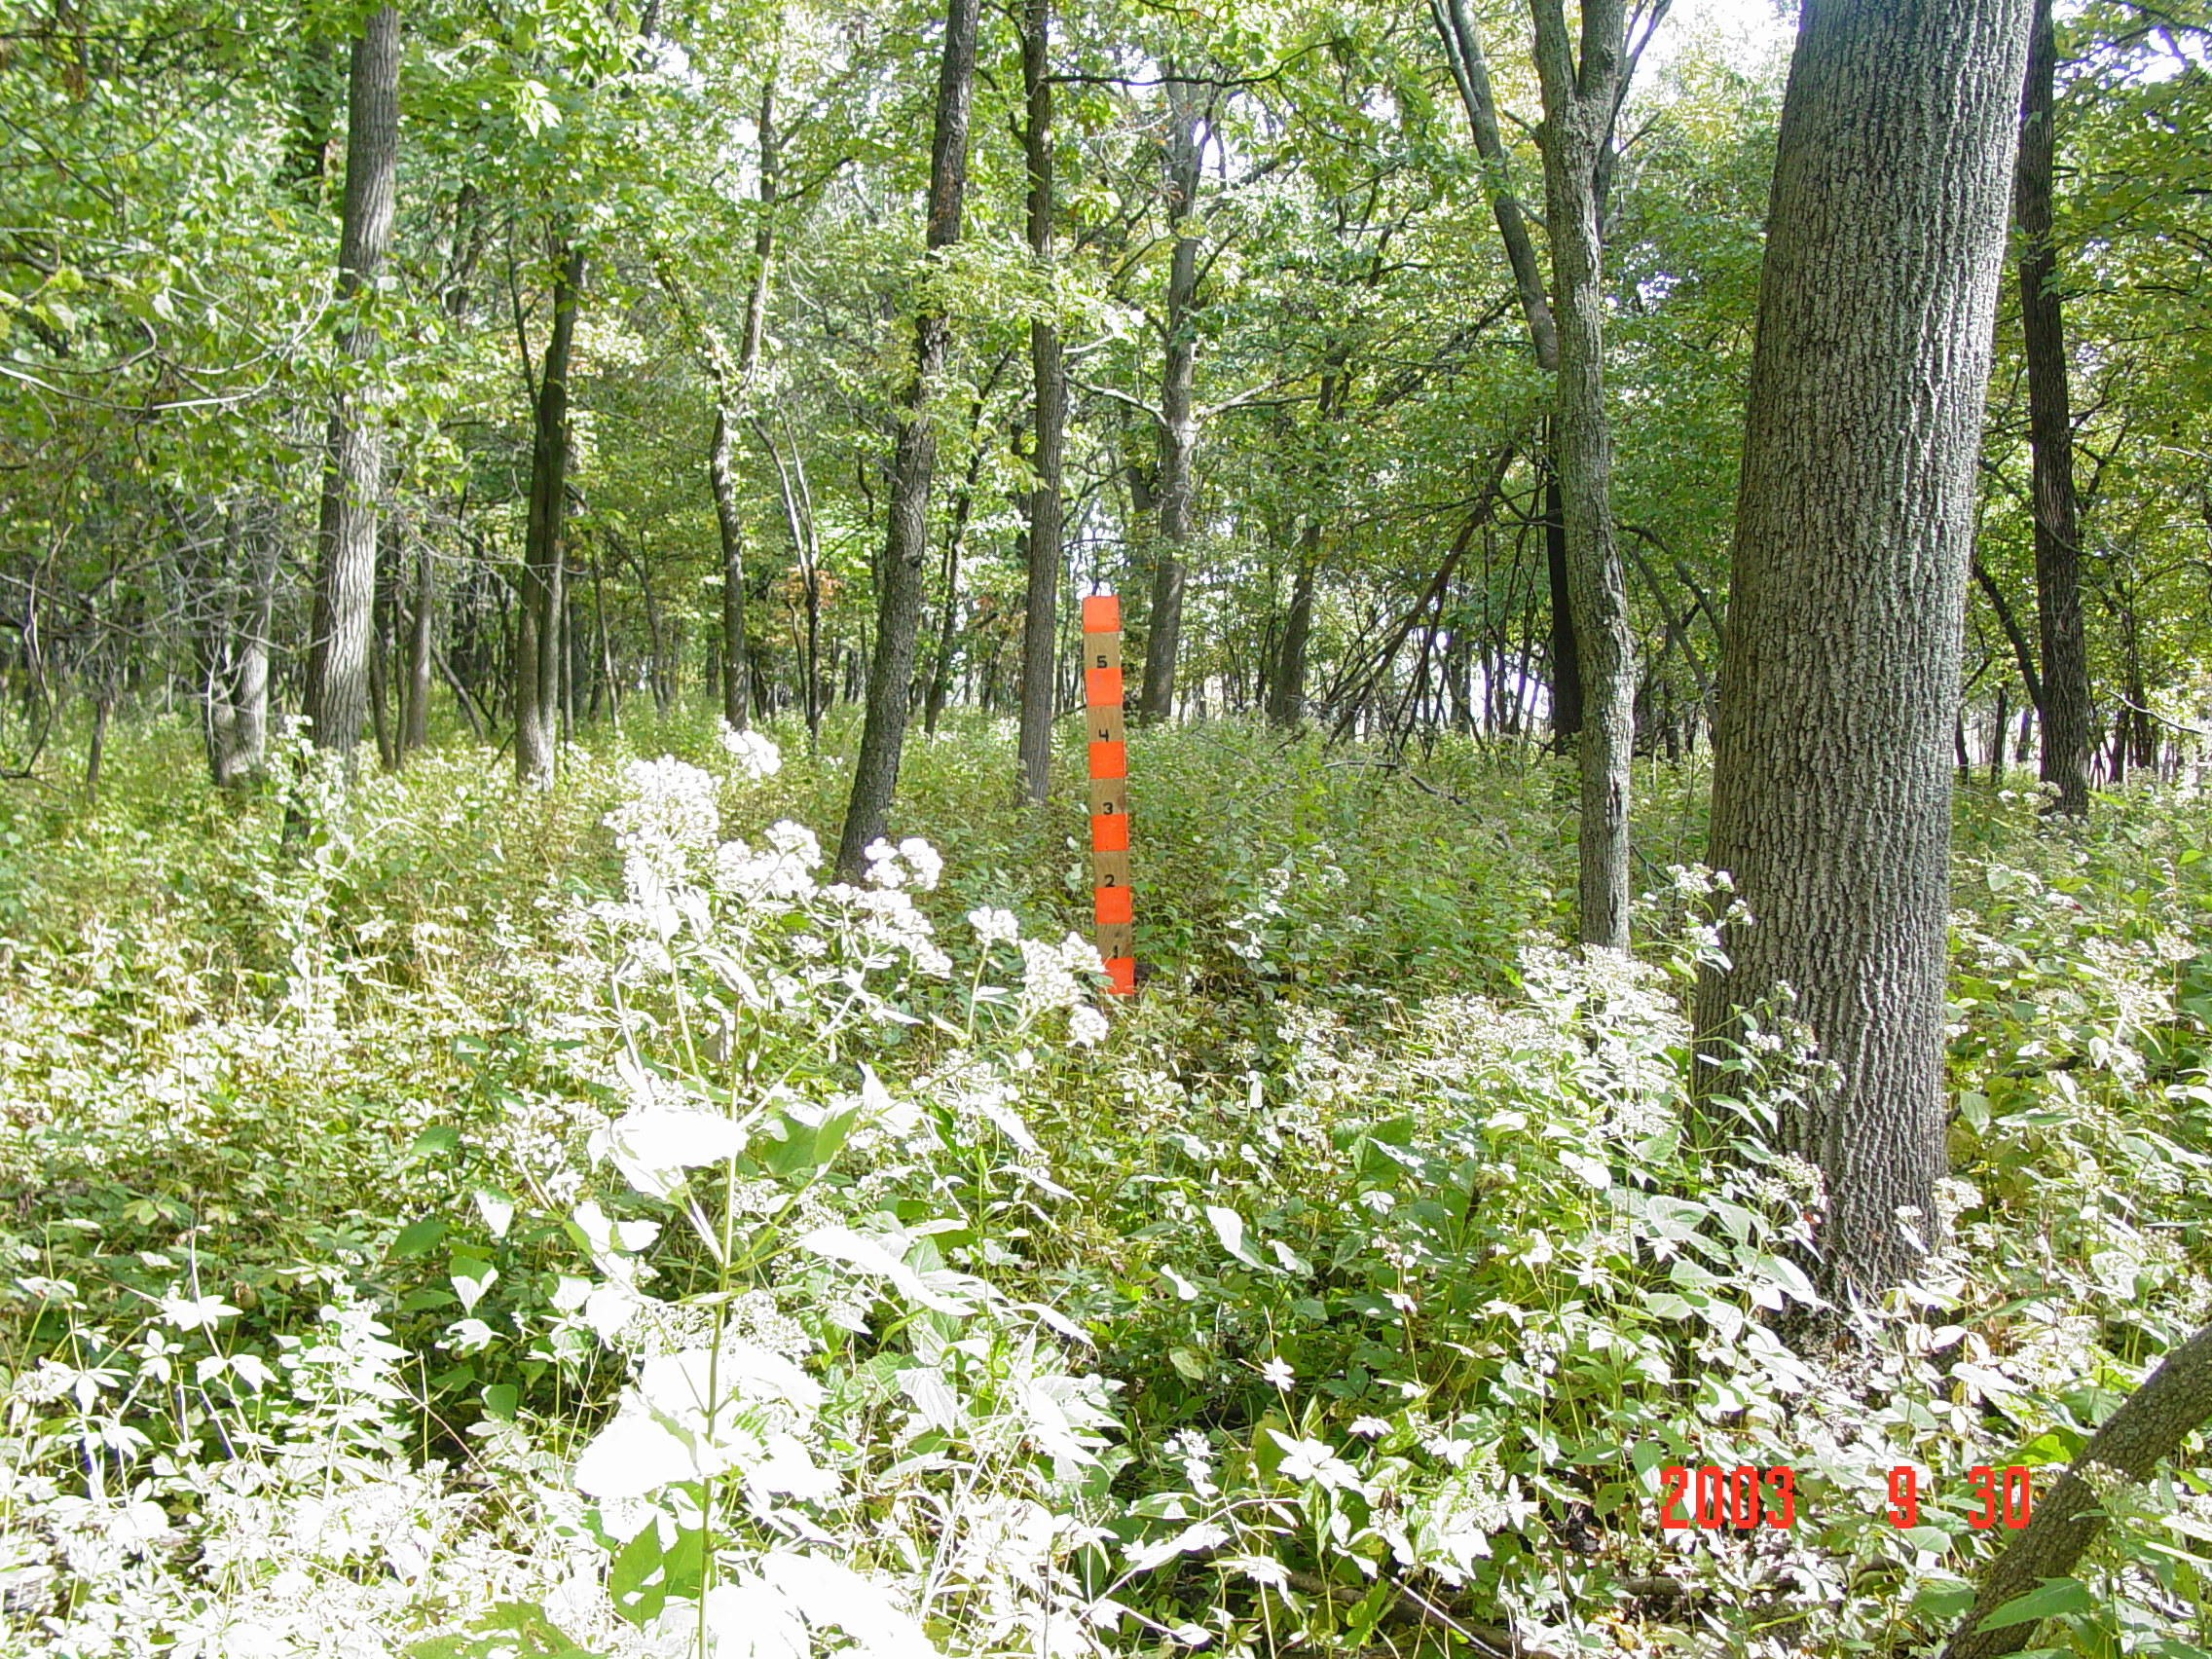
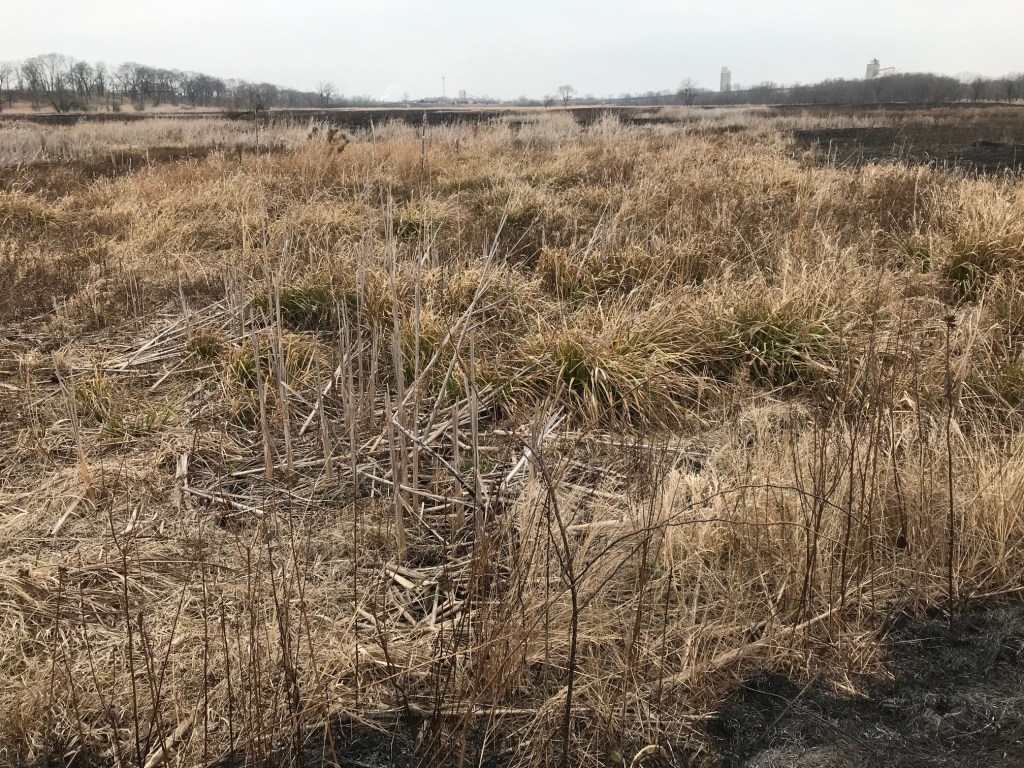
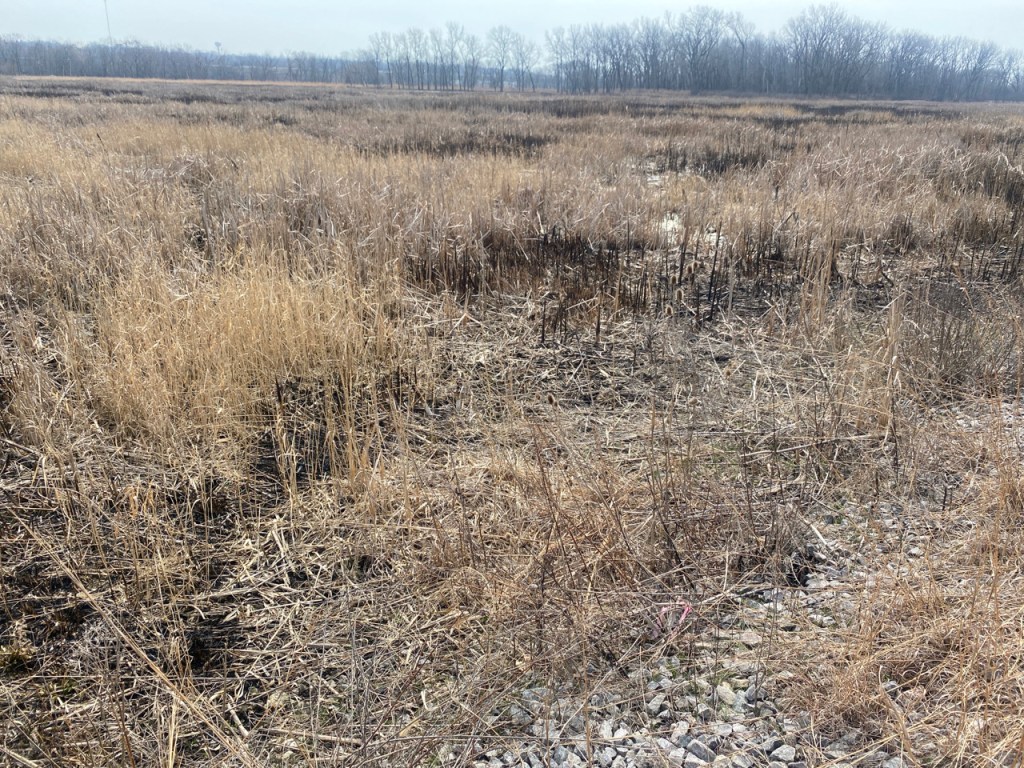
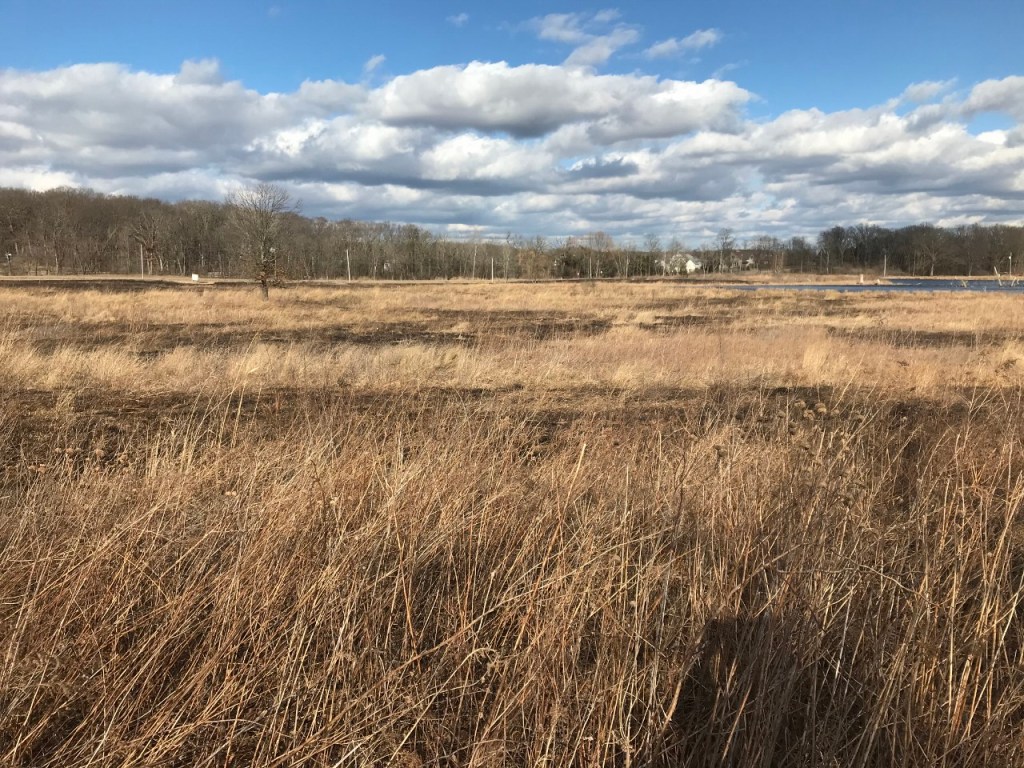
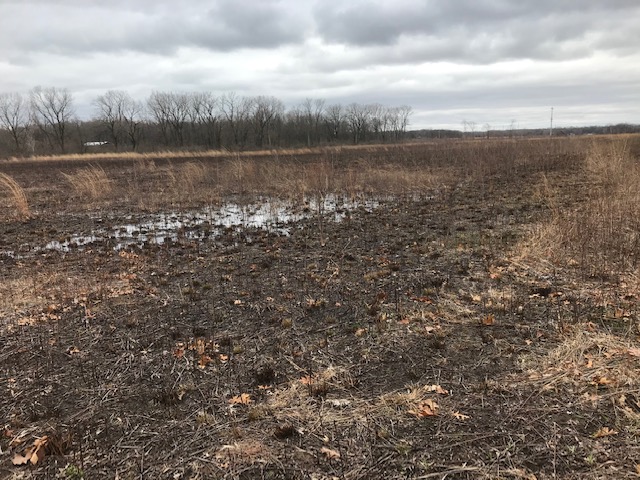
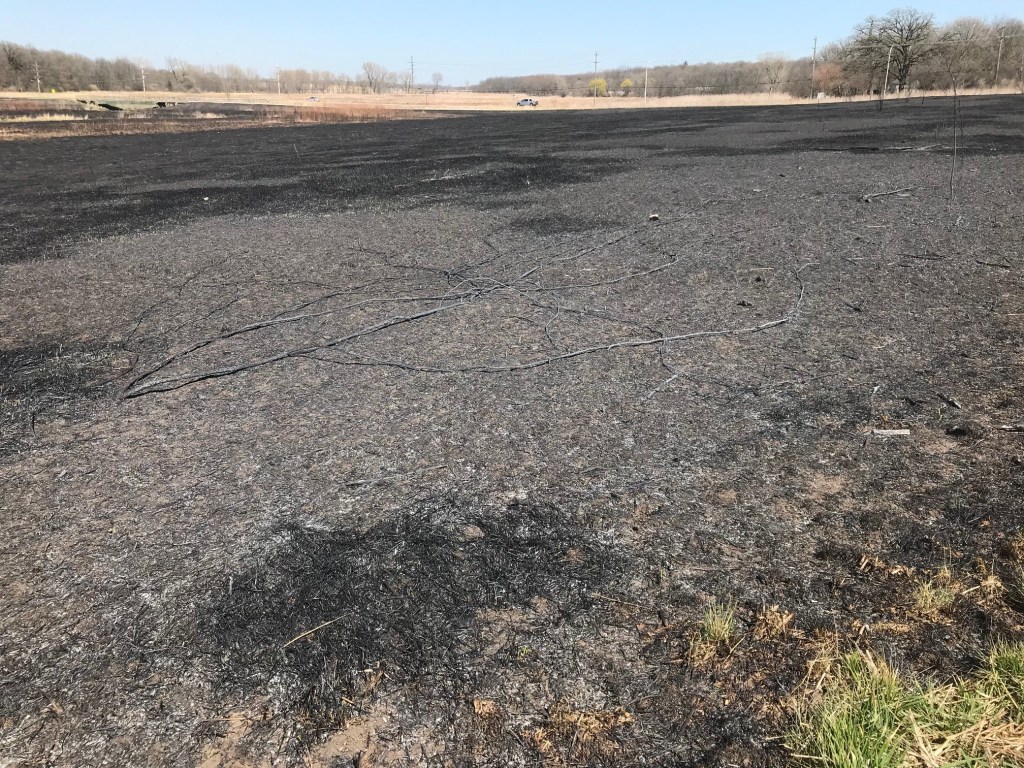
The area pictured above (with glade in the background) was treated in December of 2020. Small trees might require 6 or 7 hatchet strikes. The more thoroughly the tree is frilled, the higher chance the tree dies.
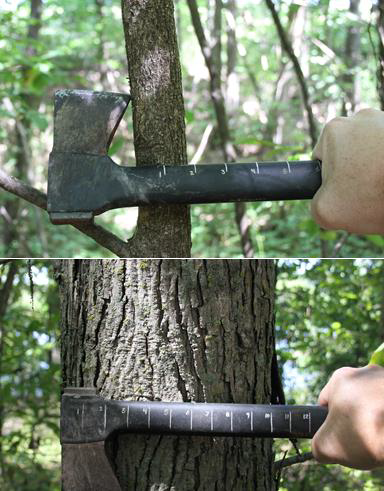
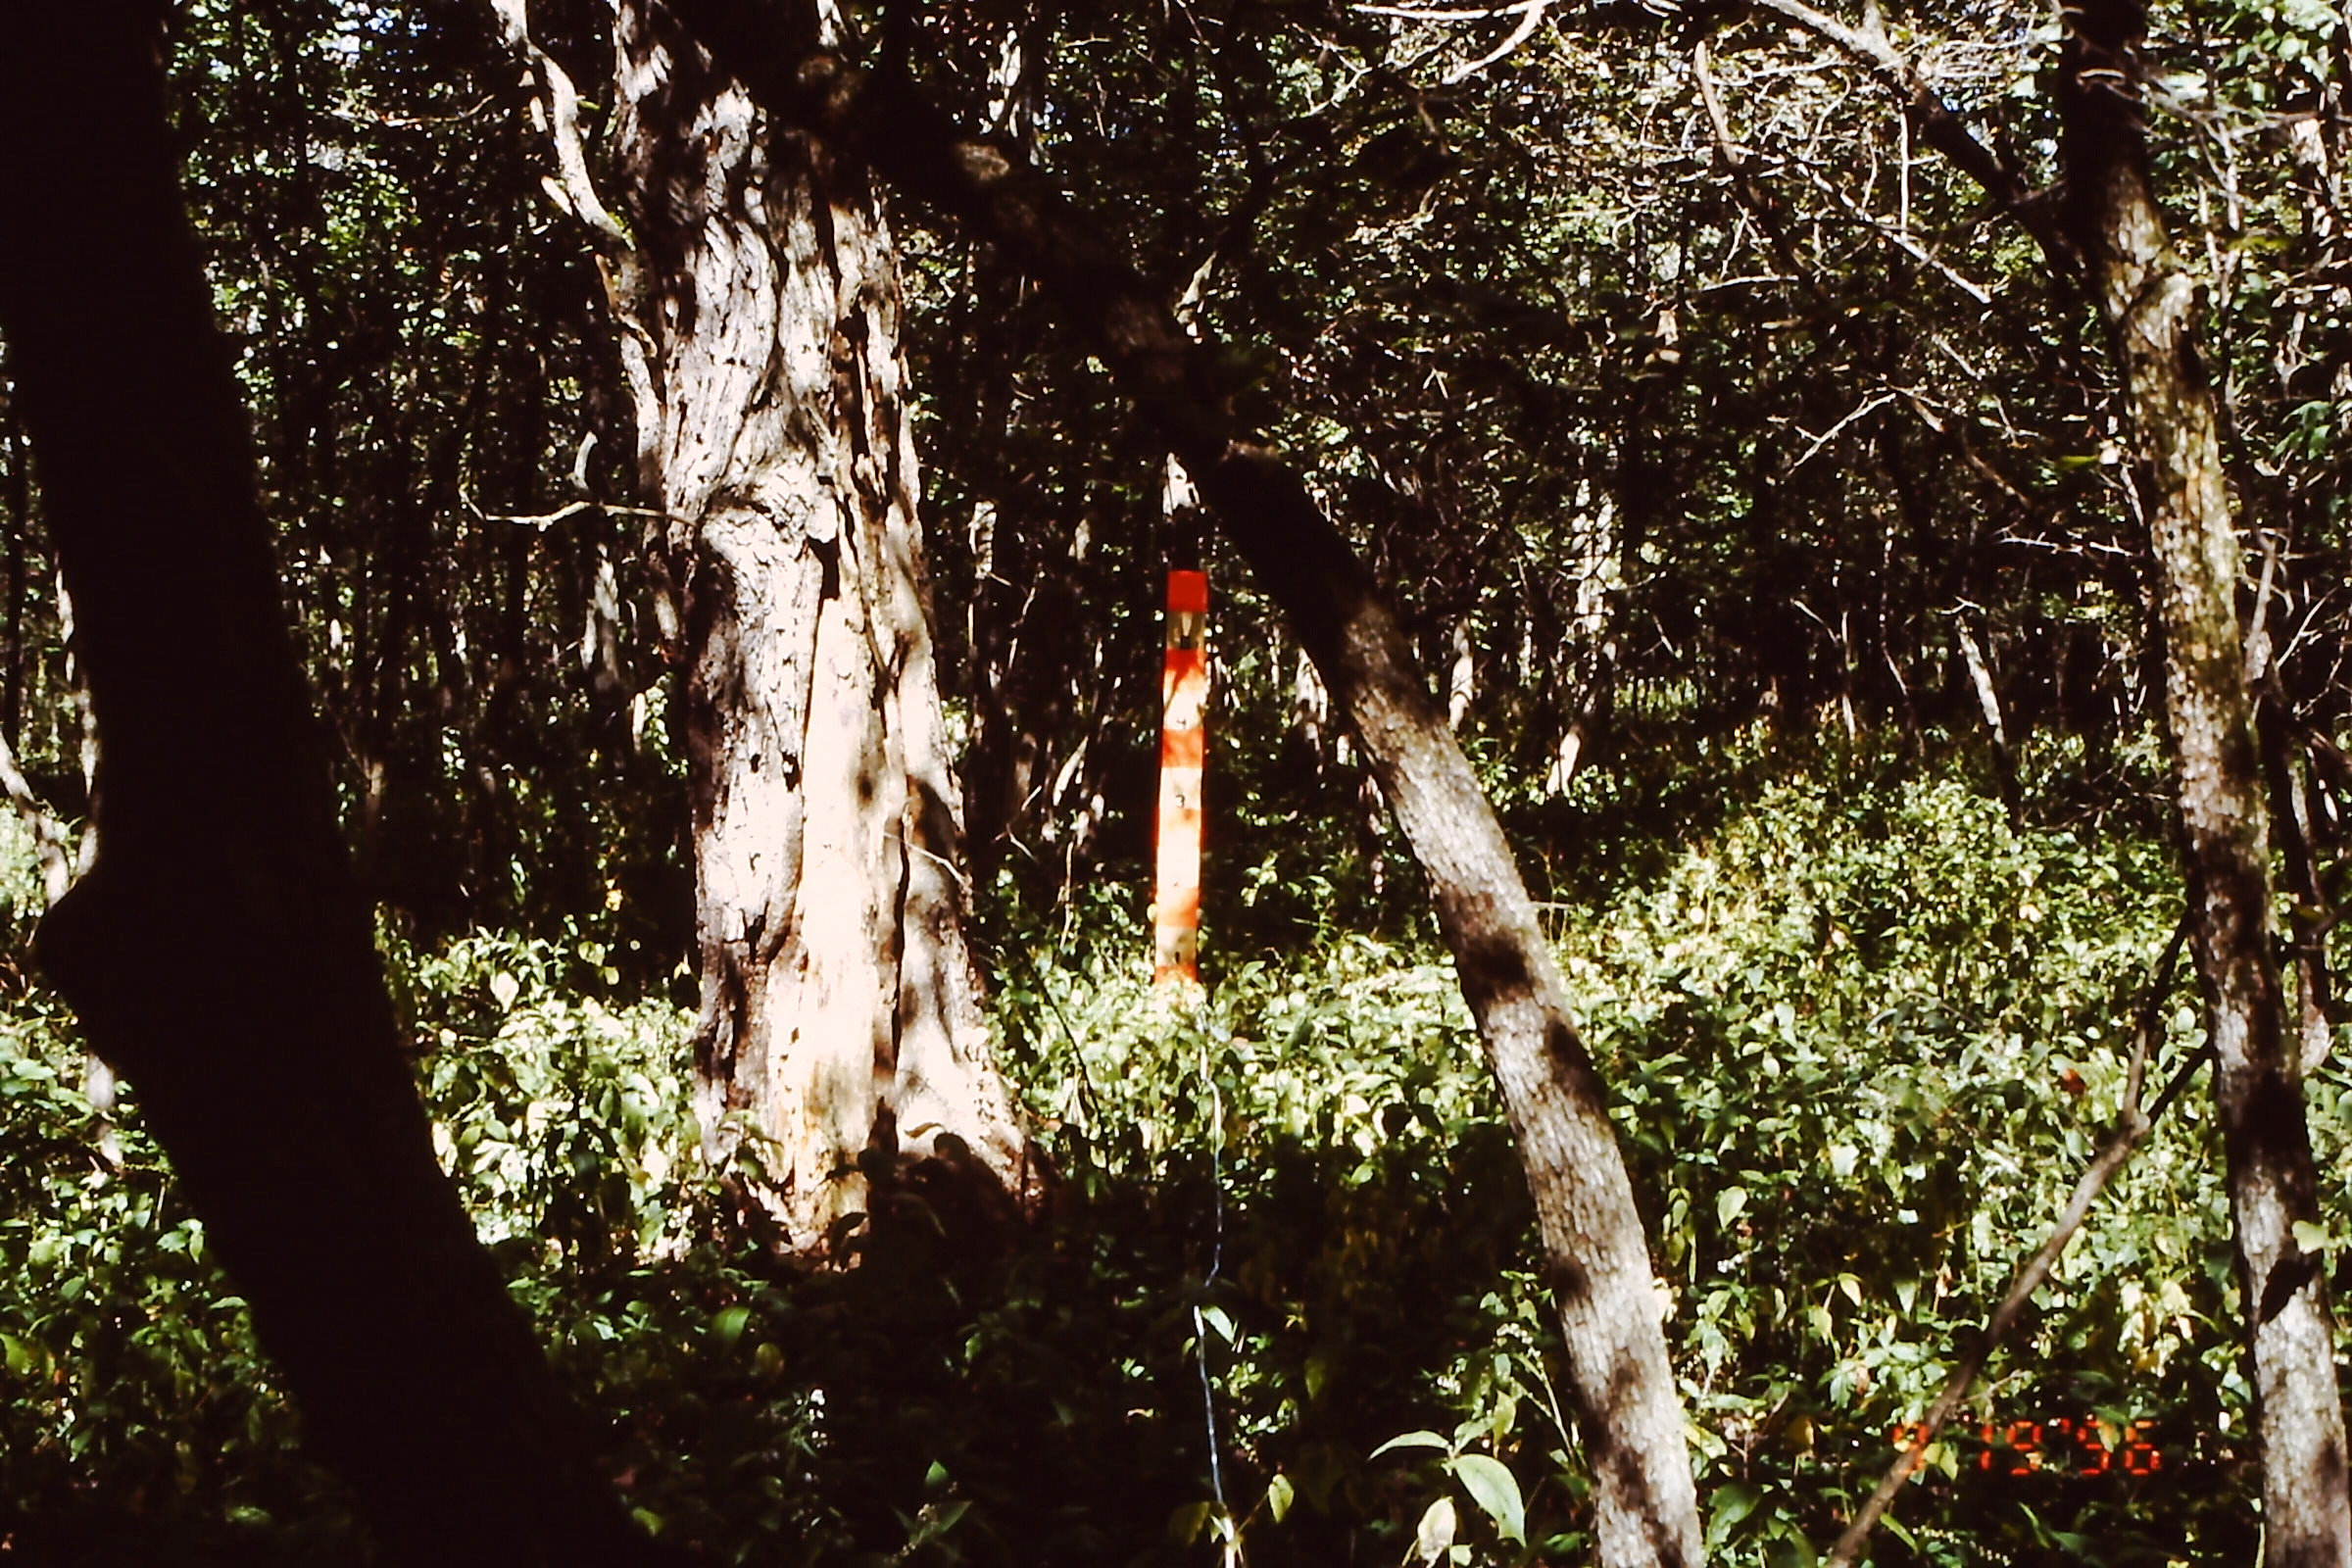
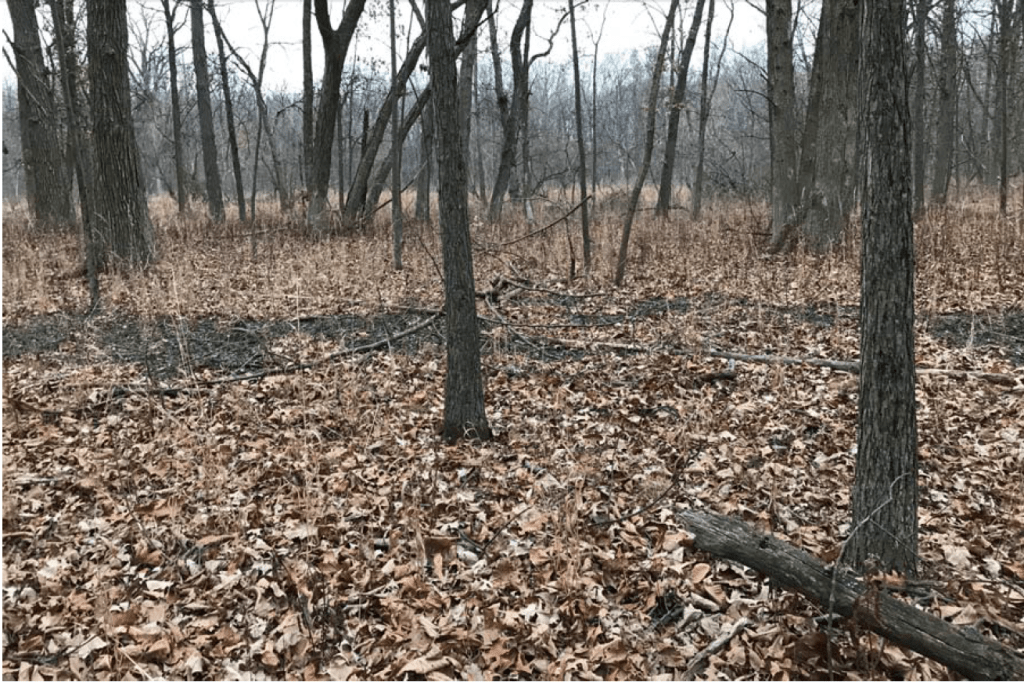
Photo credit to Matt Arndt for the above picture. Matt (contractor here in Missouri – Matt’s Healthy Woods & Wildlife) recommends 1 hatchet strike for each 1 inch in diamter.
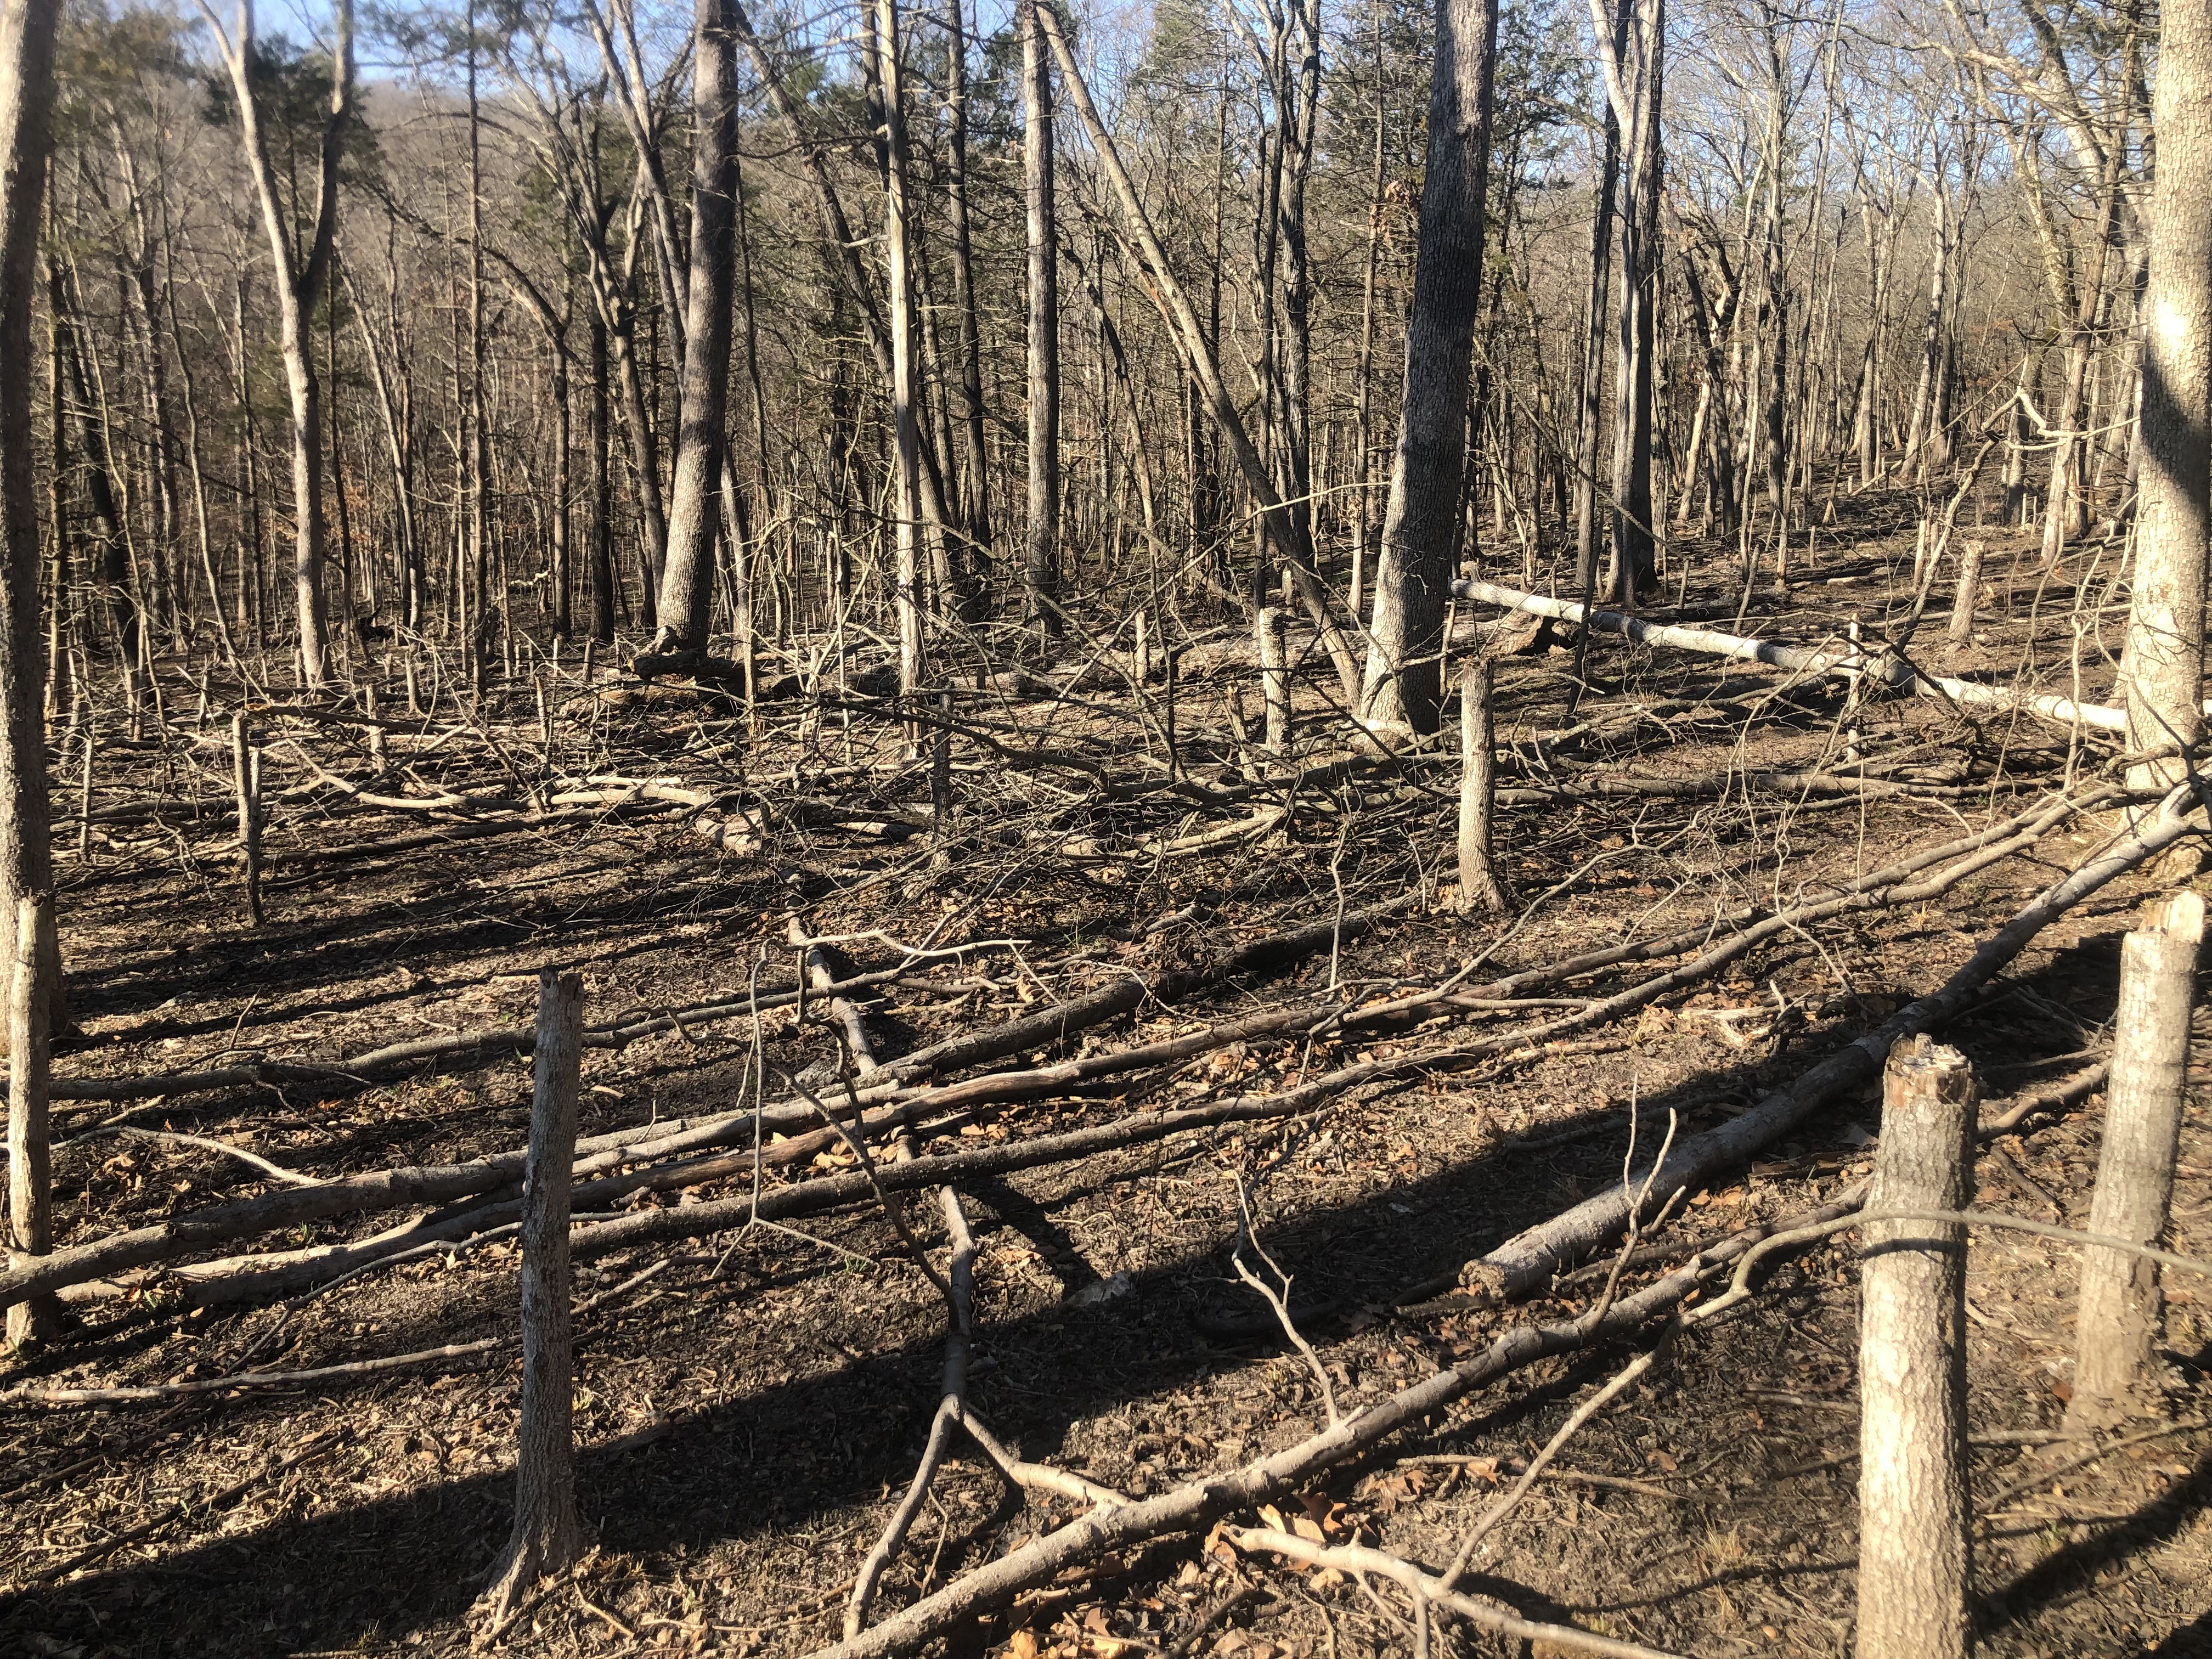
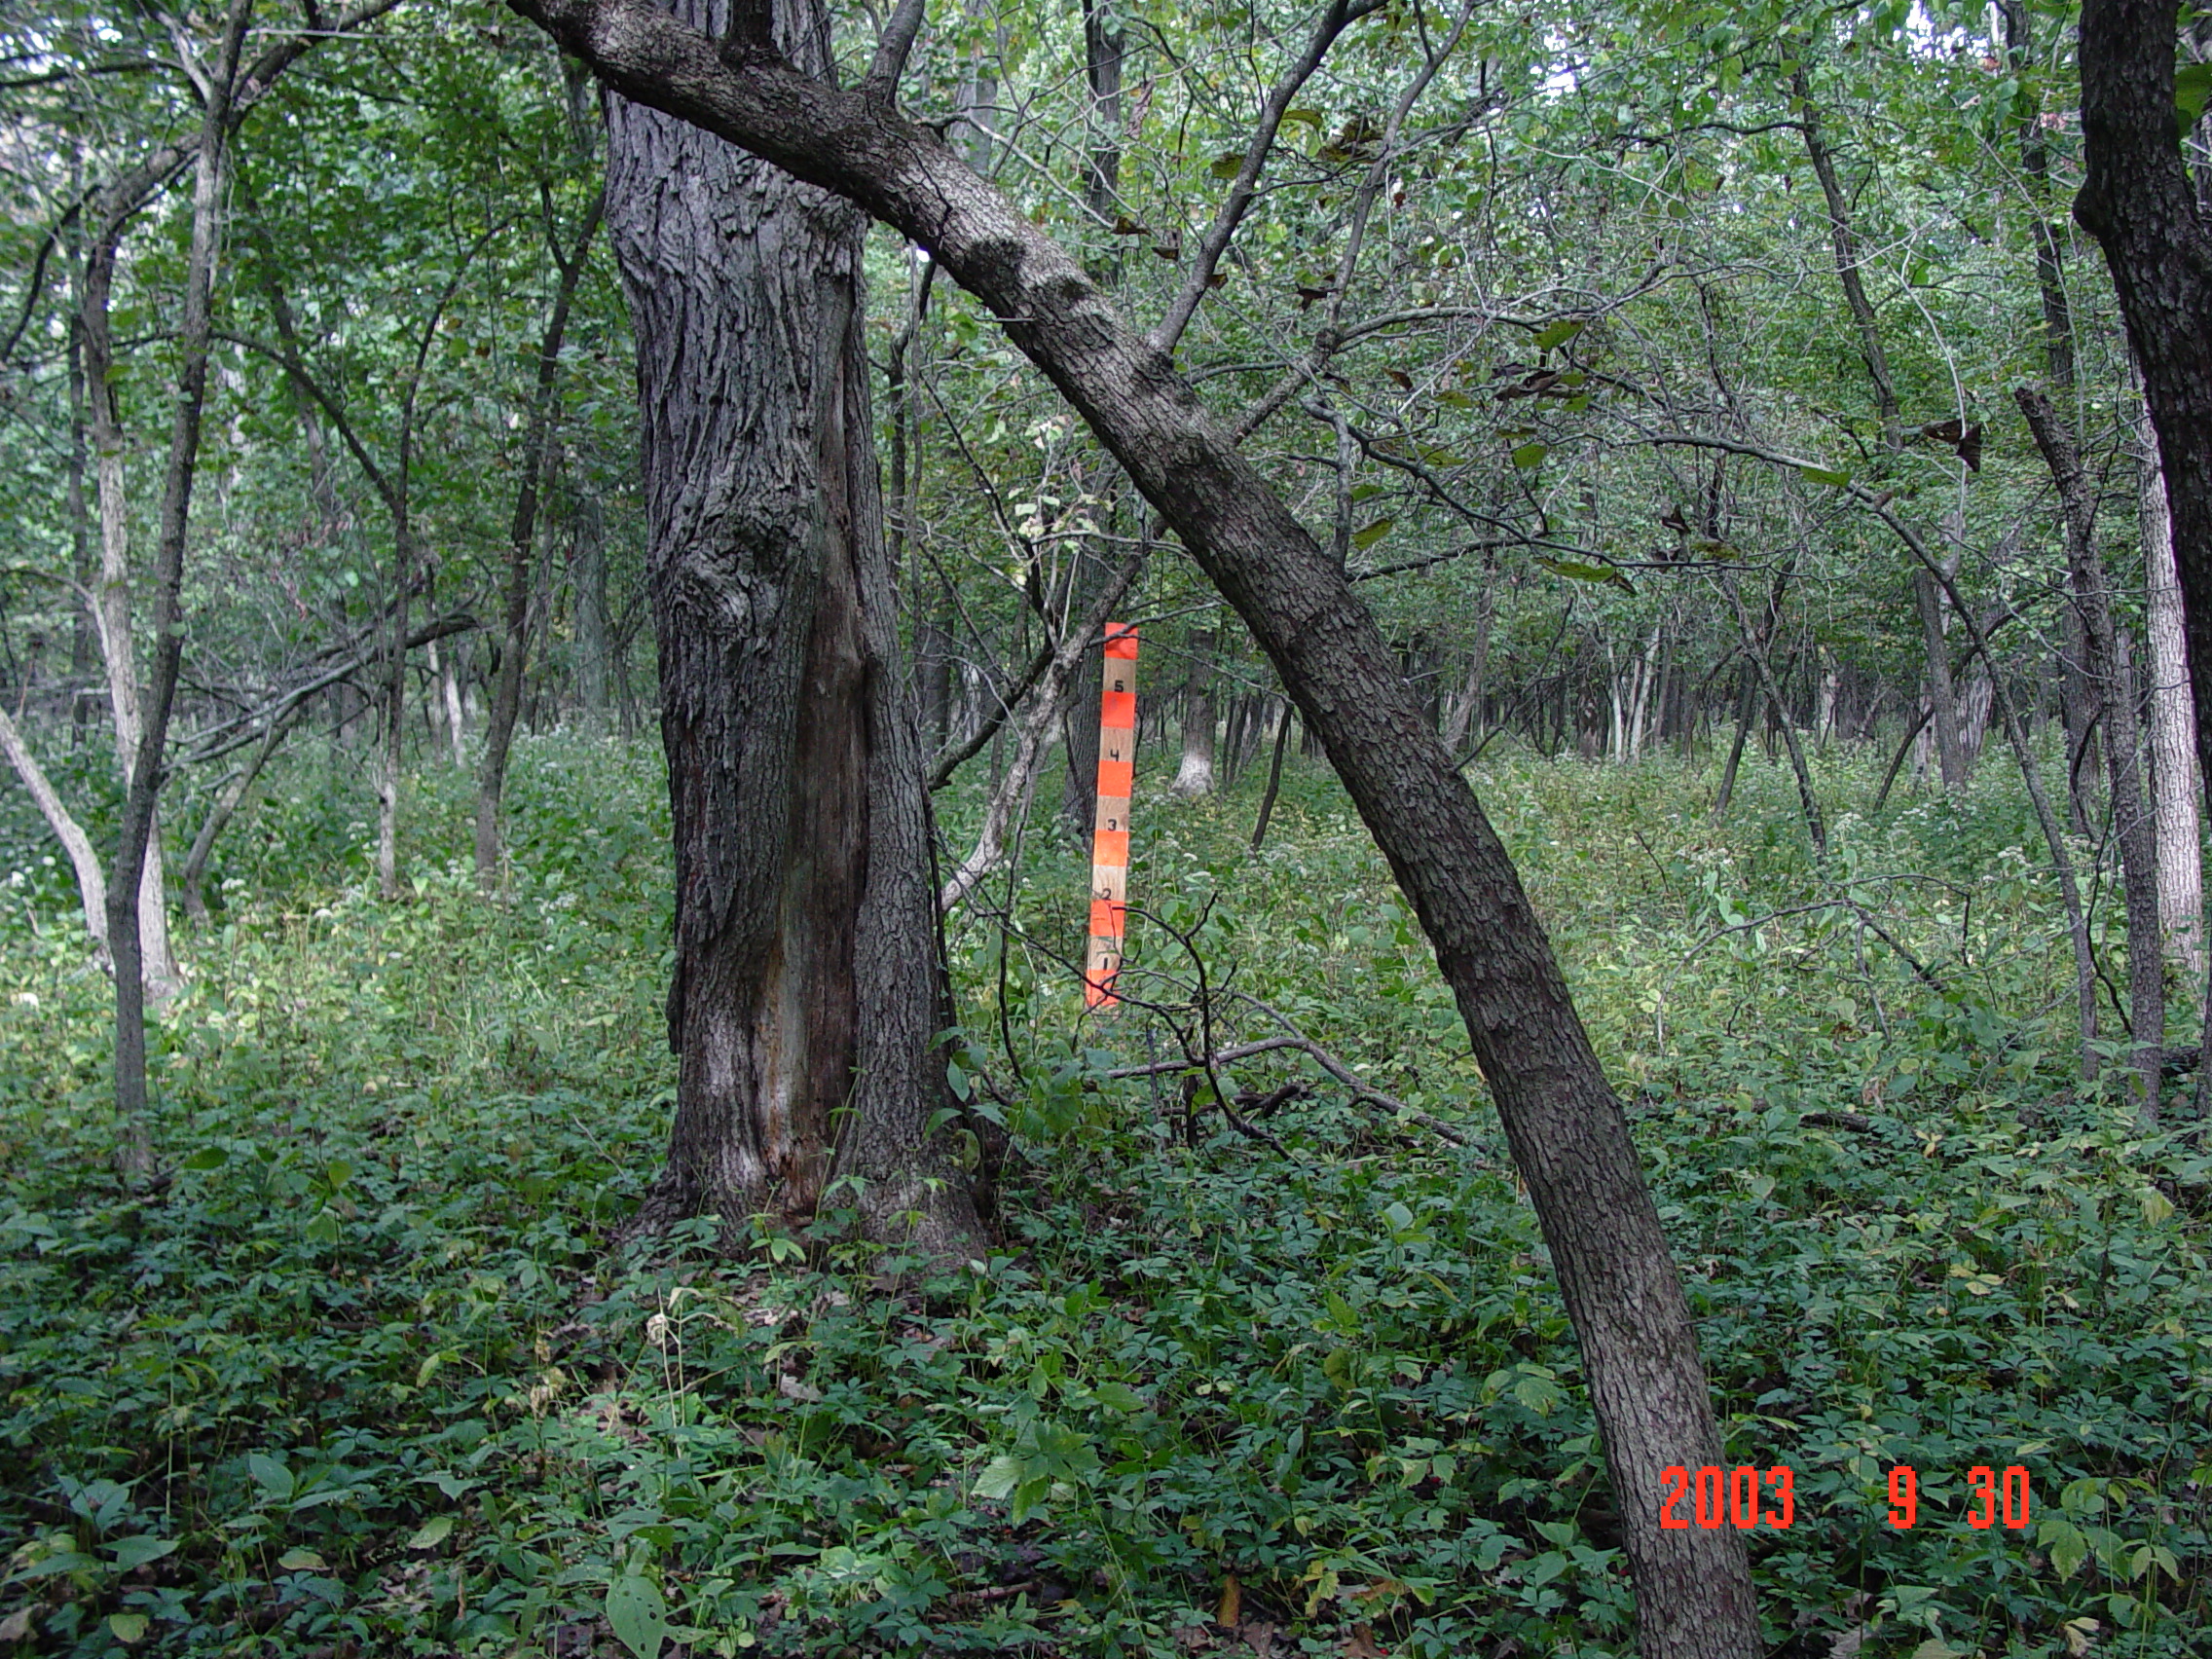
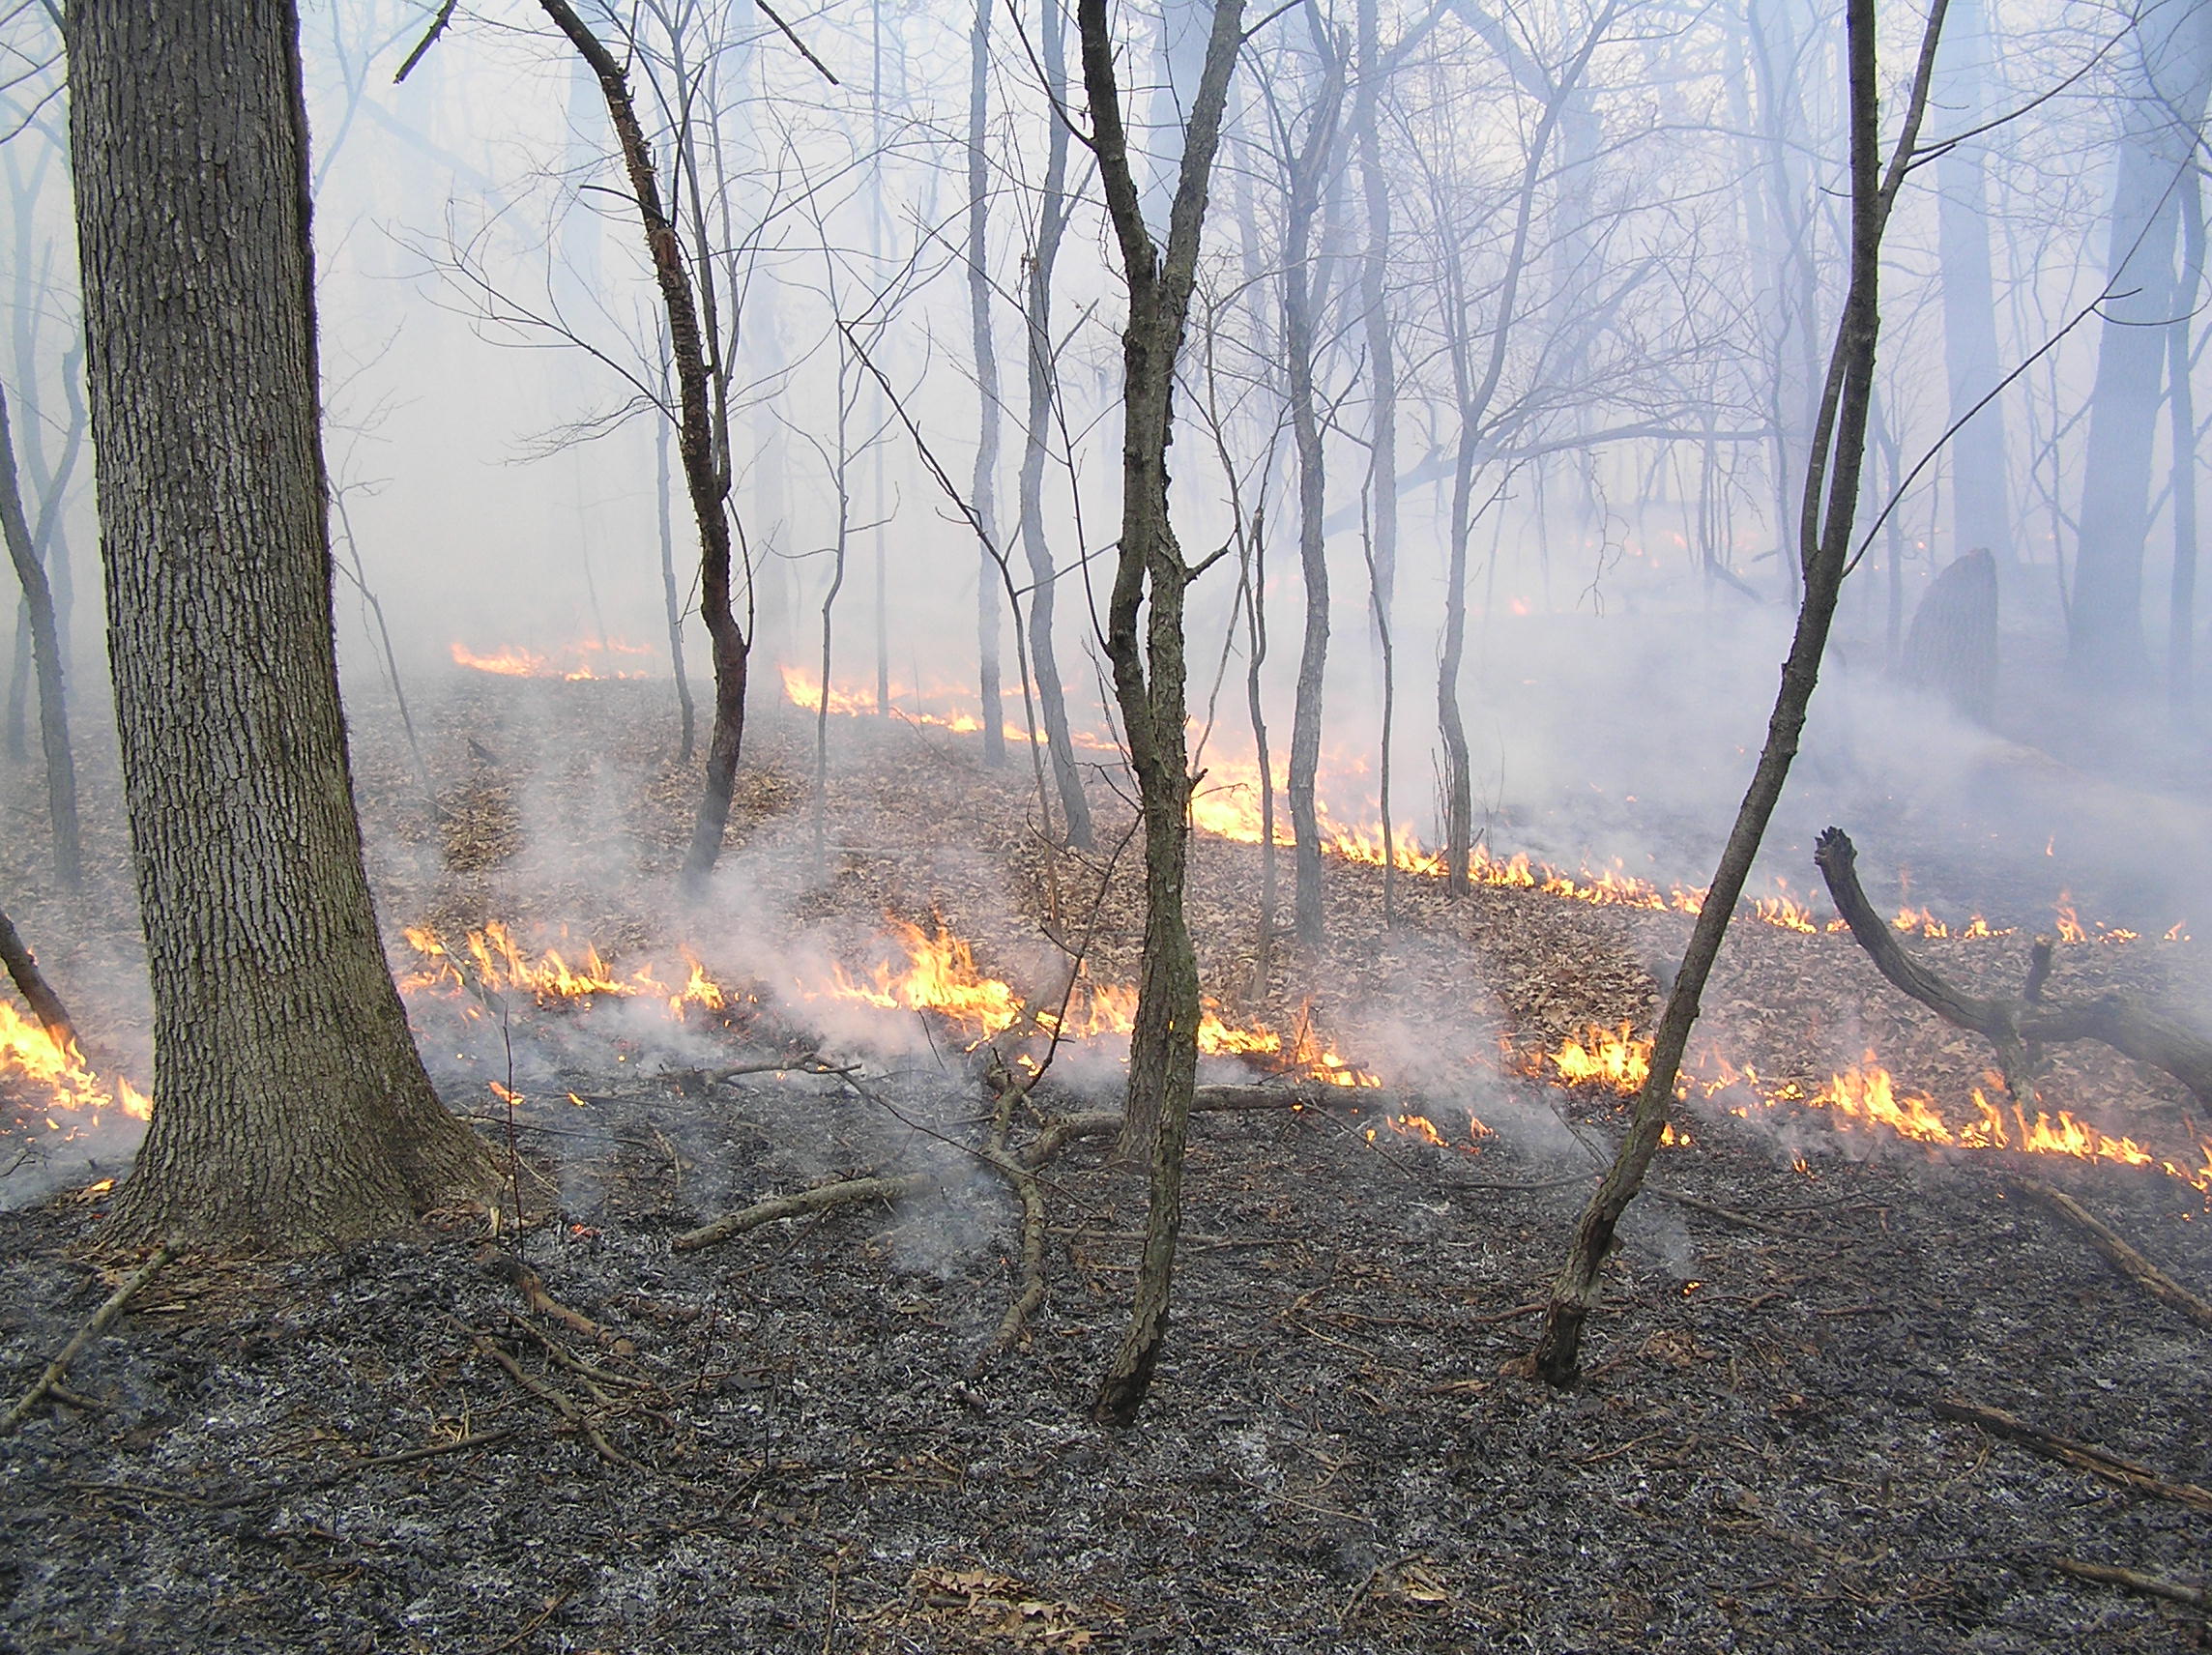
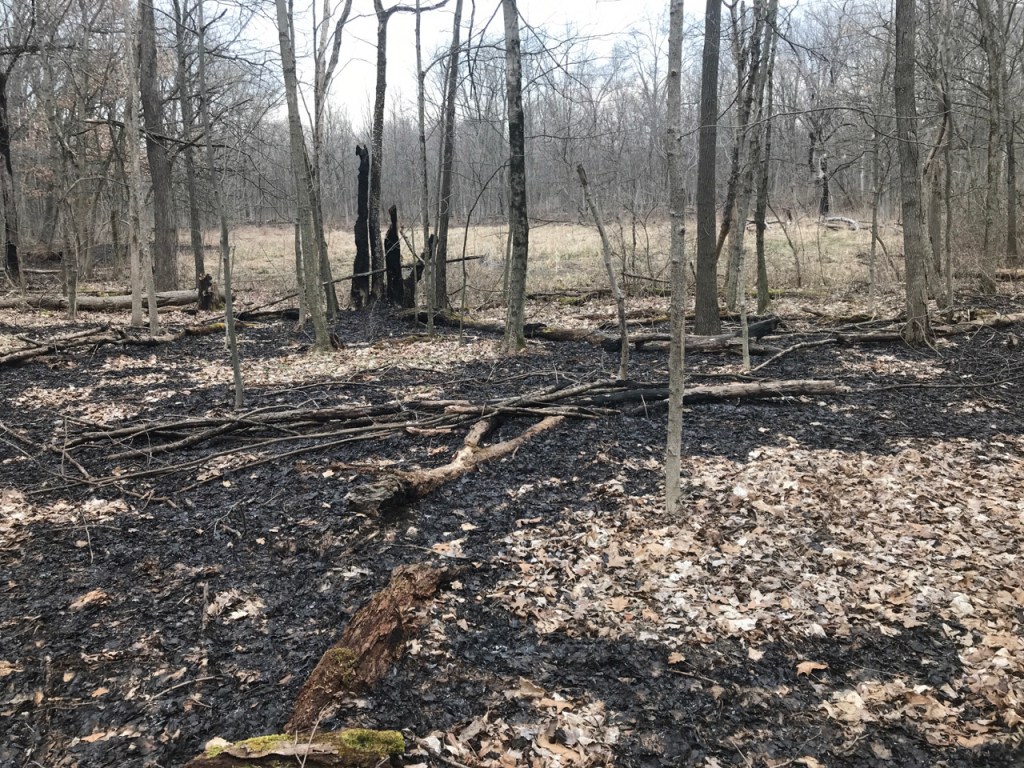
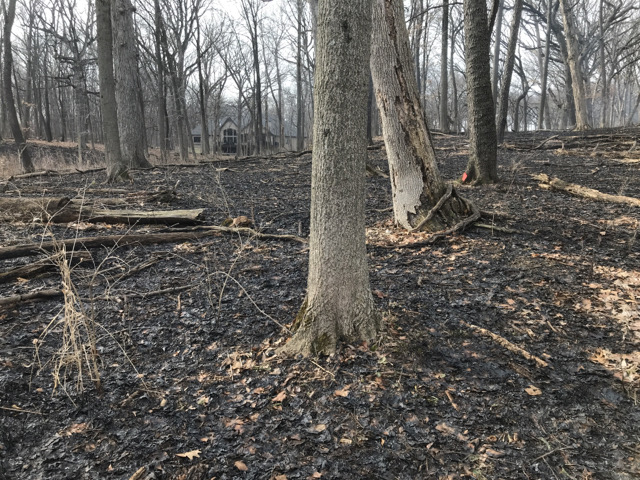
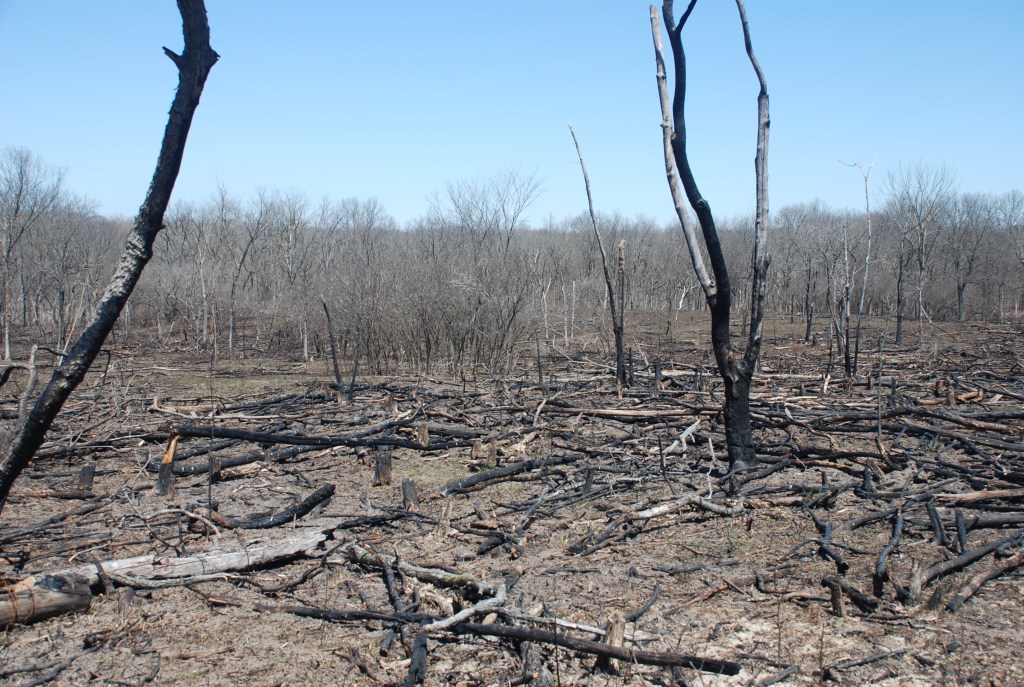
Above – treated in December 2020. Typically, the tree will leaf out poorly the first growing season. It usually won’t leaf out the second growing season. By the third growing season, fine twigs and branches drop. And by the forth growing season, the trees break off at the hatchet marks. In the picture, you can see that fire carried thoroughly through the area. Small diameter trees crumbling over a few years has not led to major fuel loading.
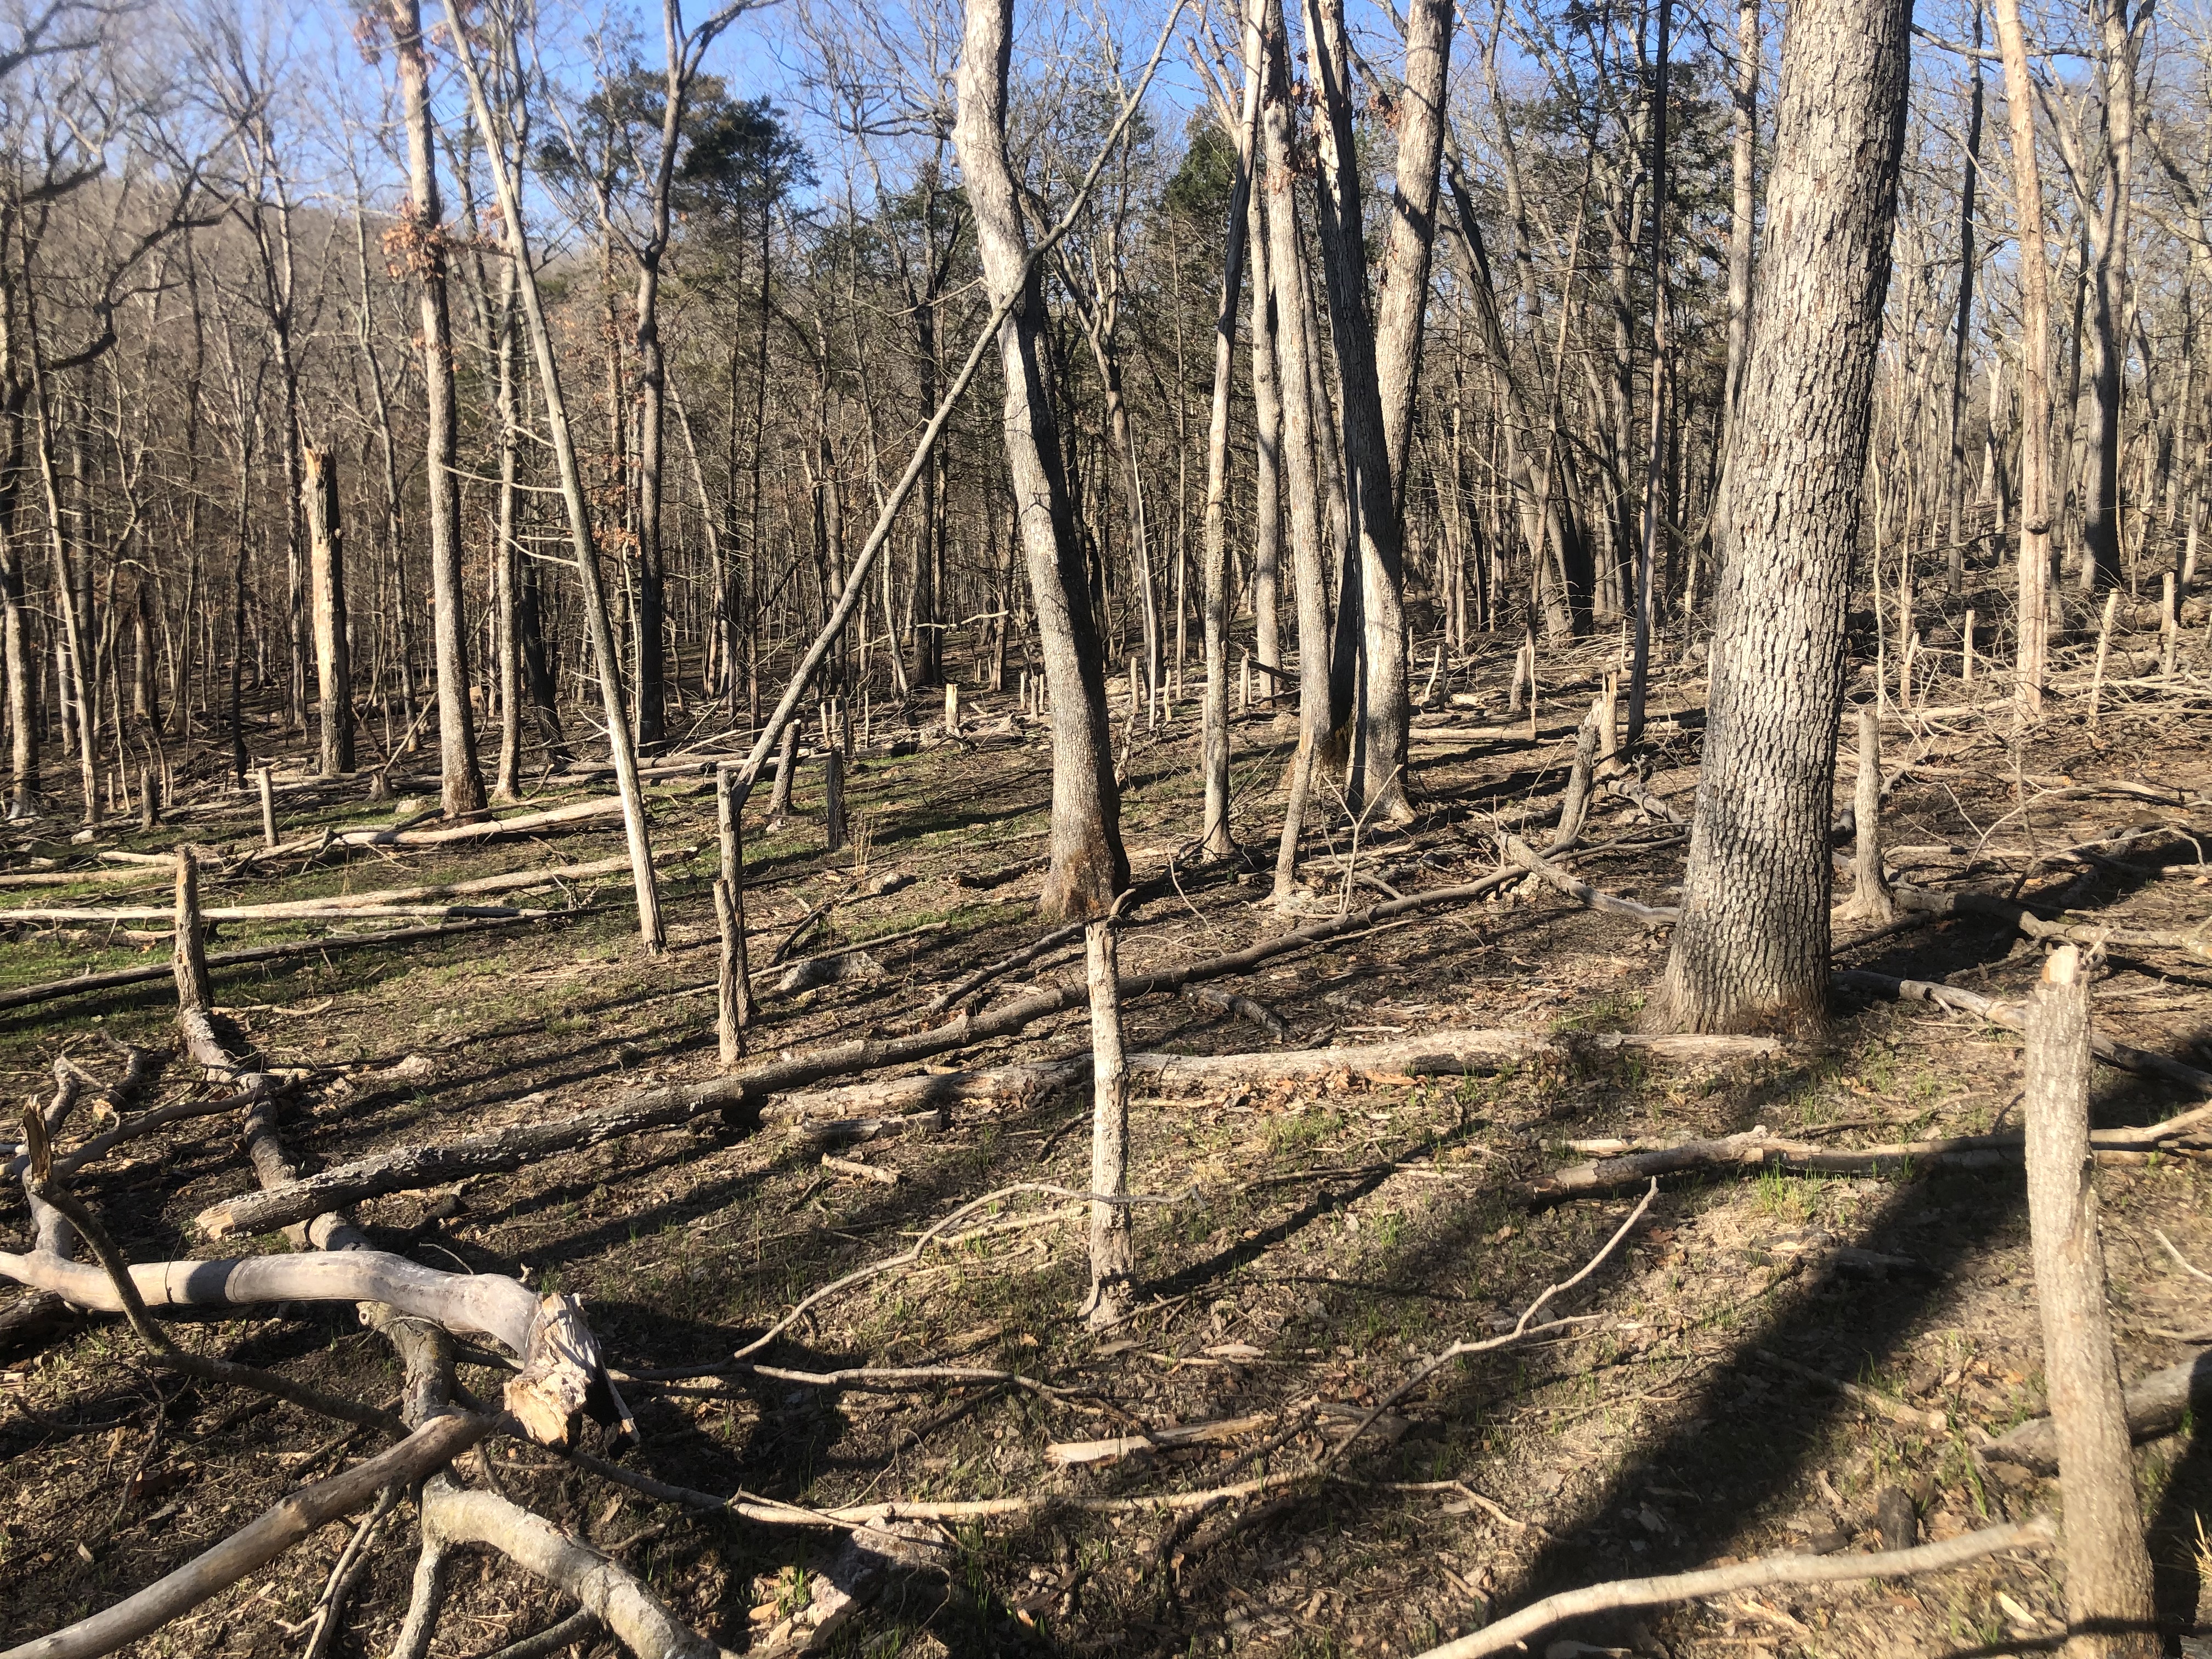

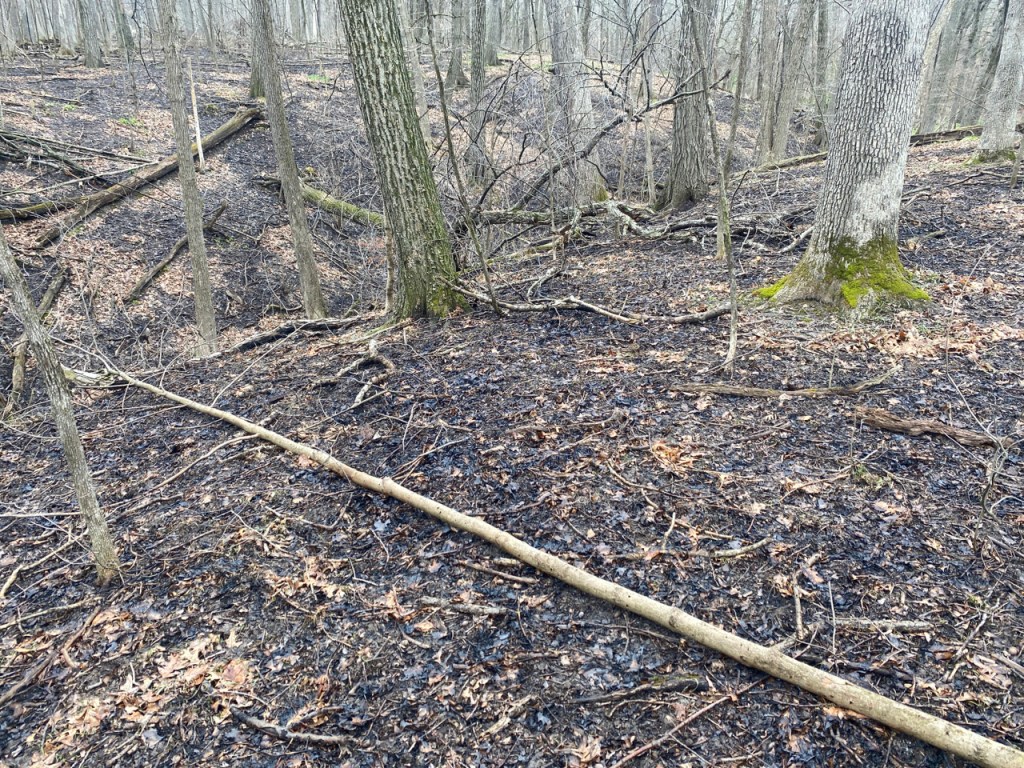
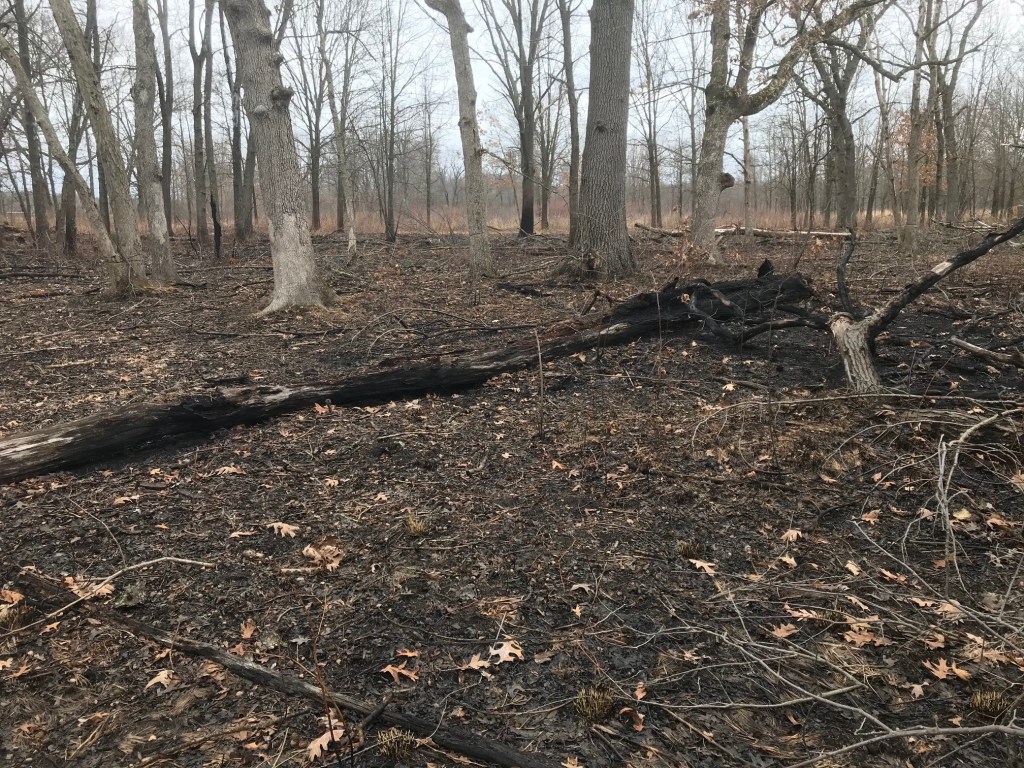
Large diameter trees are tougher to kill and take longer to crumble, but hack and squirt can be effective even in this large size class.
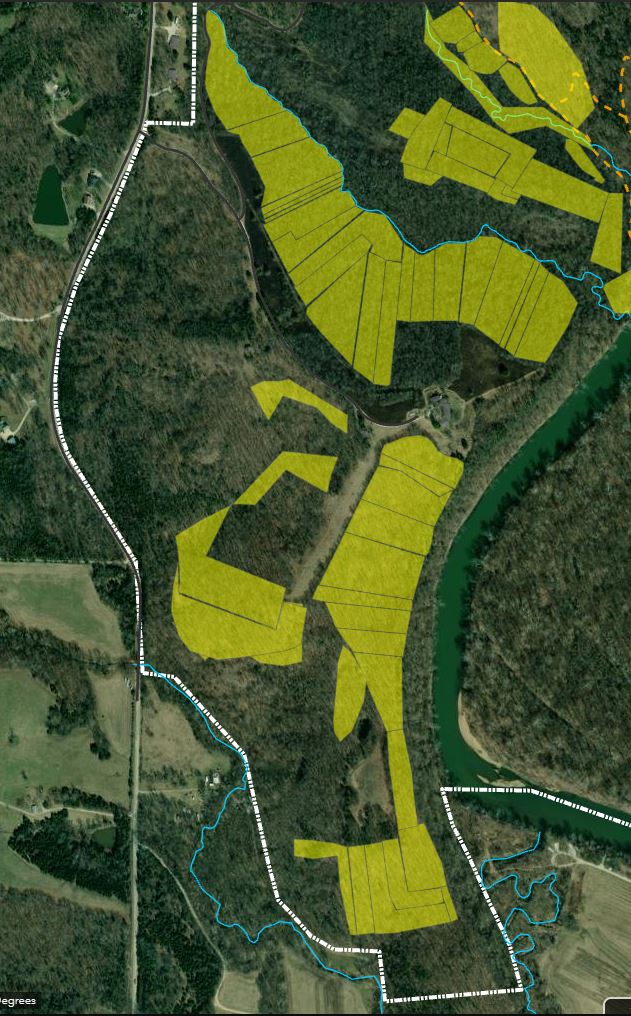
Yellow polygons represent 100 acres of treated acres with 240 staff hours. We targeted , perhaps, 70% of the maples.
This treatment is fast and effective. I like that the trees slowly crumble. I also like that you can make return trips in subsequent years and thin more until you reach your desired outcomes.