Join us in Lawrence, Kansas, to share insights from grassland restoration work, research, and outreach while experiencing this unique ecotone region. Small remnant prairies in eastern Kansas host exceptional levels of plant diversity, and the combination of conservation and working lands create a heterogeneous landscape relevant to many restoration opportunities and challenges. Local experts will share their knowledge of ethnobotany, plant ecology, biodiversity, microbiomes, fungi, and feedback in soil in the context of restoring grasslands. A field tour of the KU Field Station will showcase a medicinal plant garden; research on the interactive effects of climate, mycorrhizae, and biodiversity on restored prairie; and a participatory art experience that applies cultural burning in a restored grassland.
Details and registration information coming in May 2025.
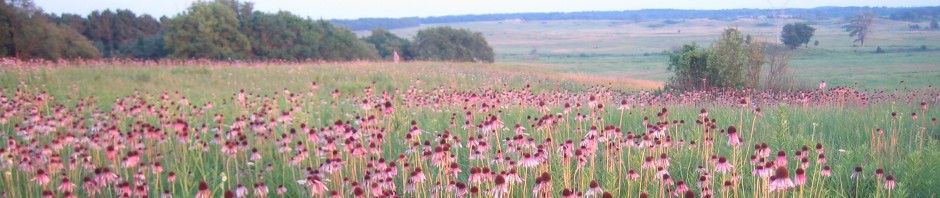
Mike Saxton – Shaw Nature Reserve – Gray Summit, MO
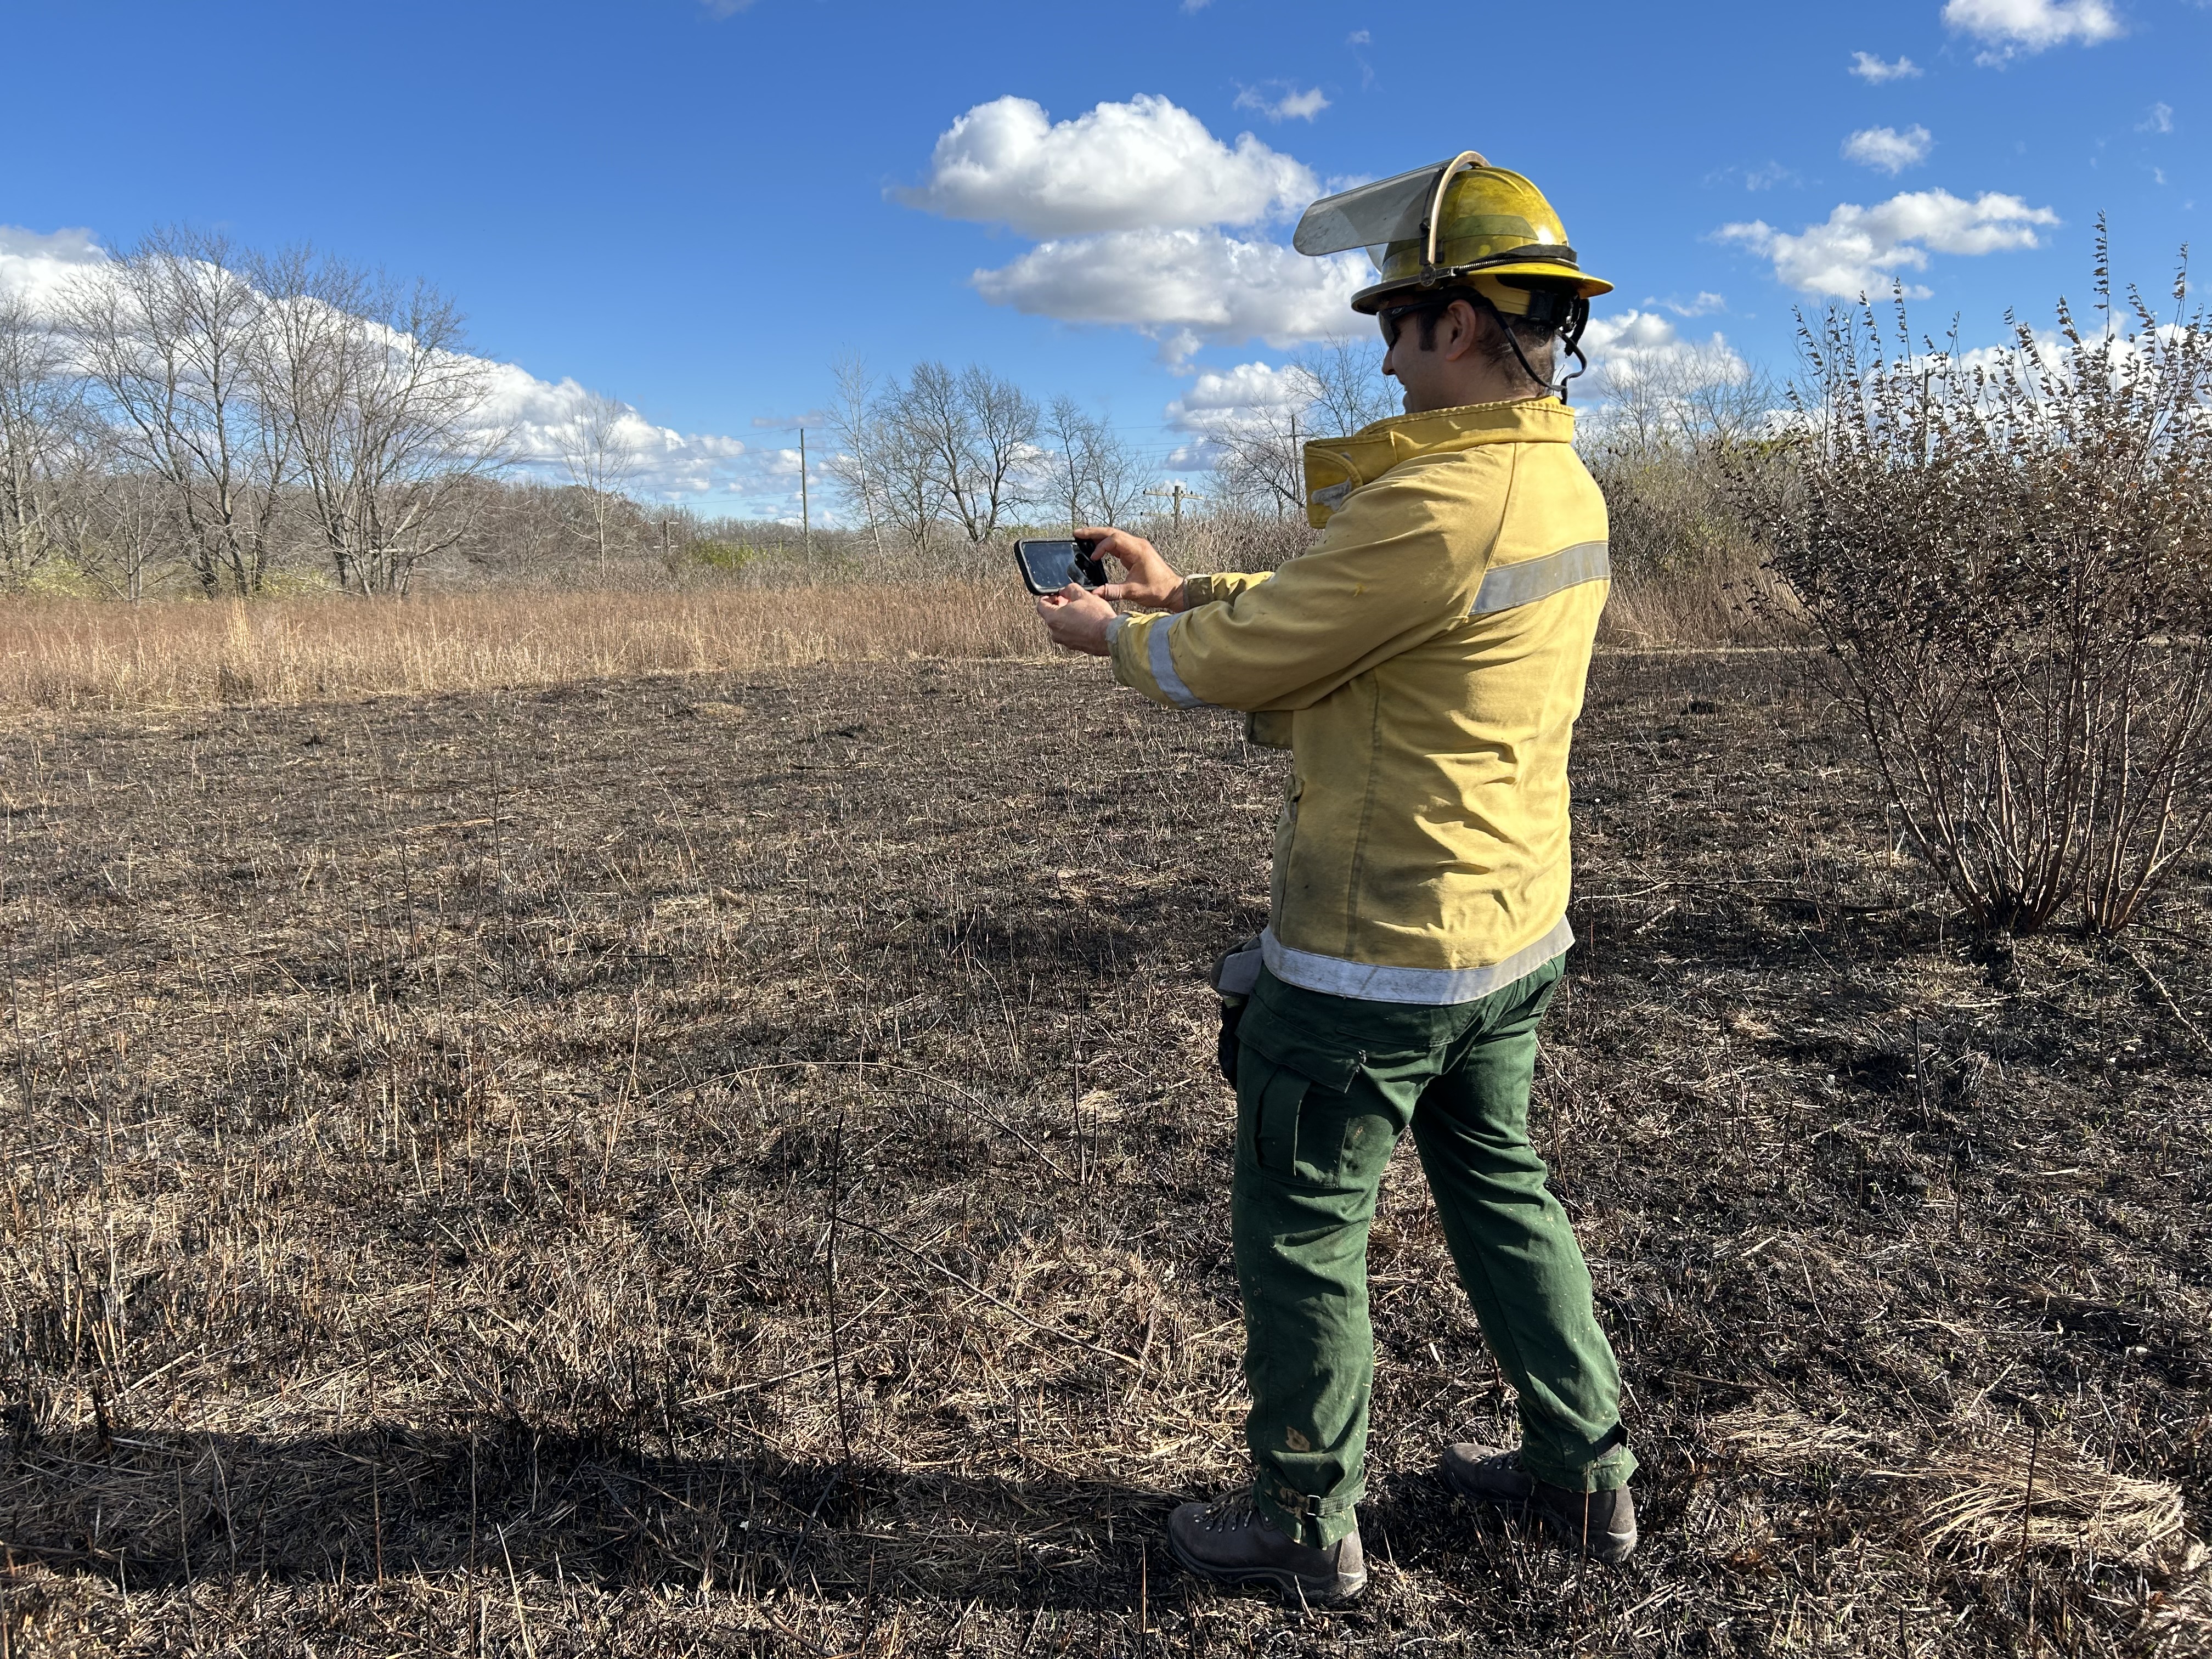
Last week we sowed around 1,200 pounds of seed from 302 species over 46 acres of ground at Shaw Nature Reserve. Most of that seed went into a 42 acre planting as part of our 120-acre, 3-year Wolf Run Grassland Restoration Project. Here are some lessons learned from this year’s sowing.
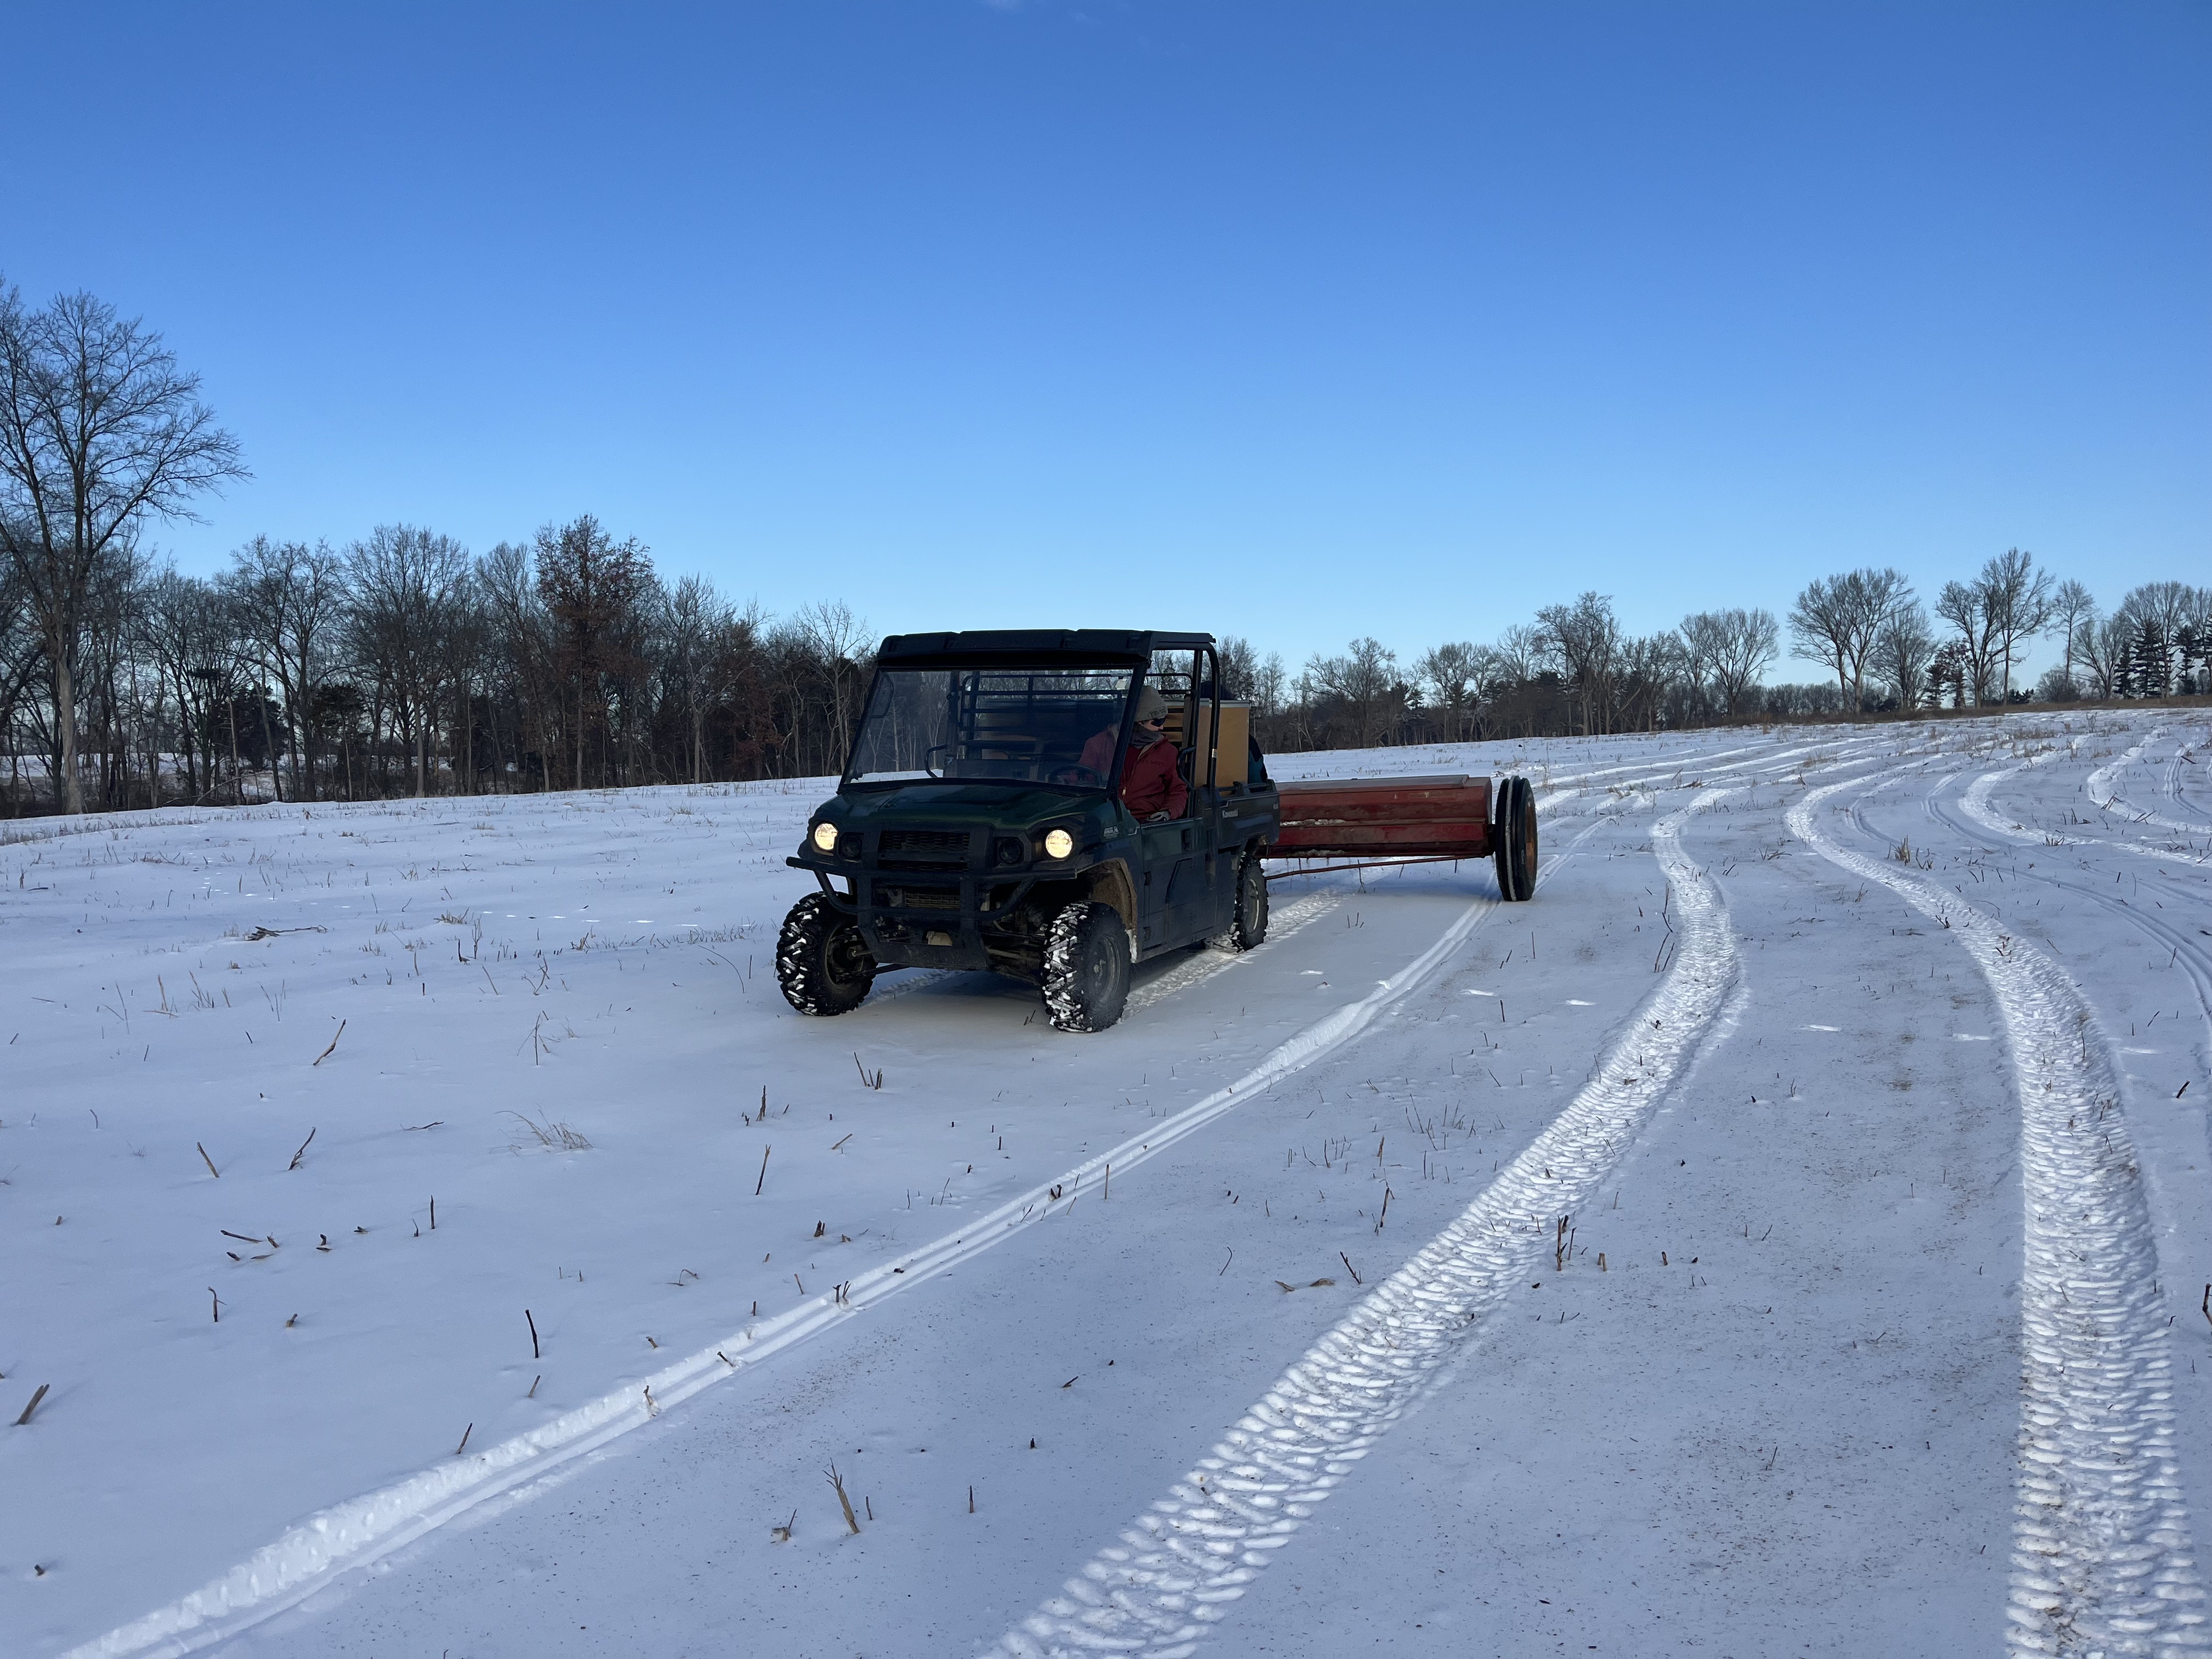
Sowing in snow – is it possible to sow seed without snow? Of course. You can follow the rows if you are planting into corn stubble. You can use cones or flags if you’re planting into bean stubble. You can use GPS apps (which, of course, have course resolution, usually something like 10 – 30 ft if using a cell phone). But snow allows you to sow seed very evenly and methodically.
Operator can be very efficient and can avoid underlap and overlap. Sowing seed on snow allows you to assess coverage and seeding rate.
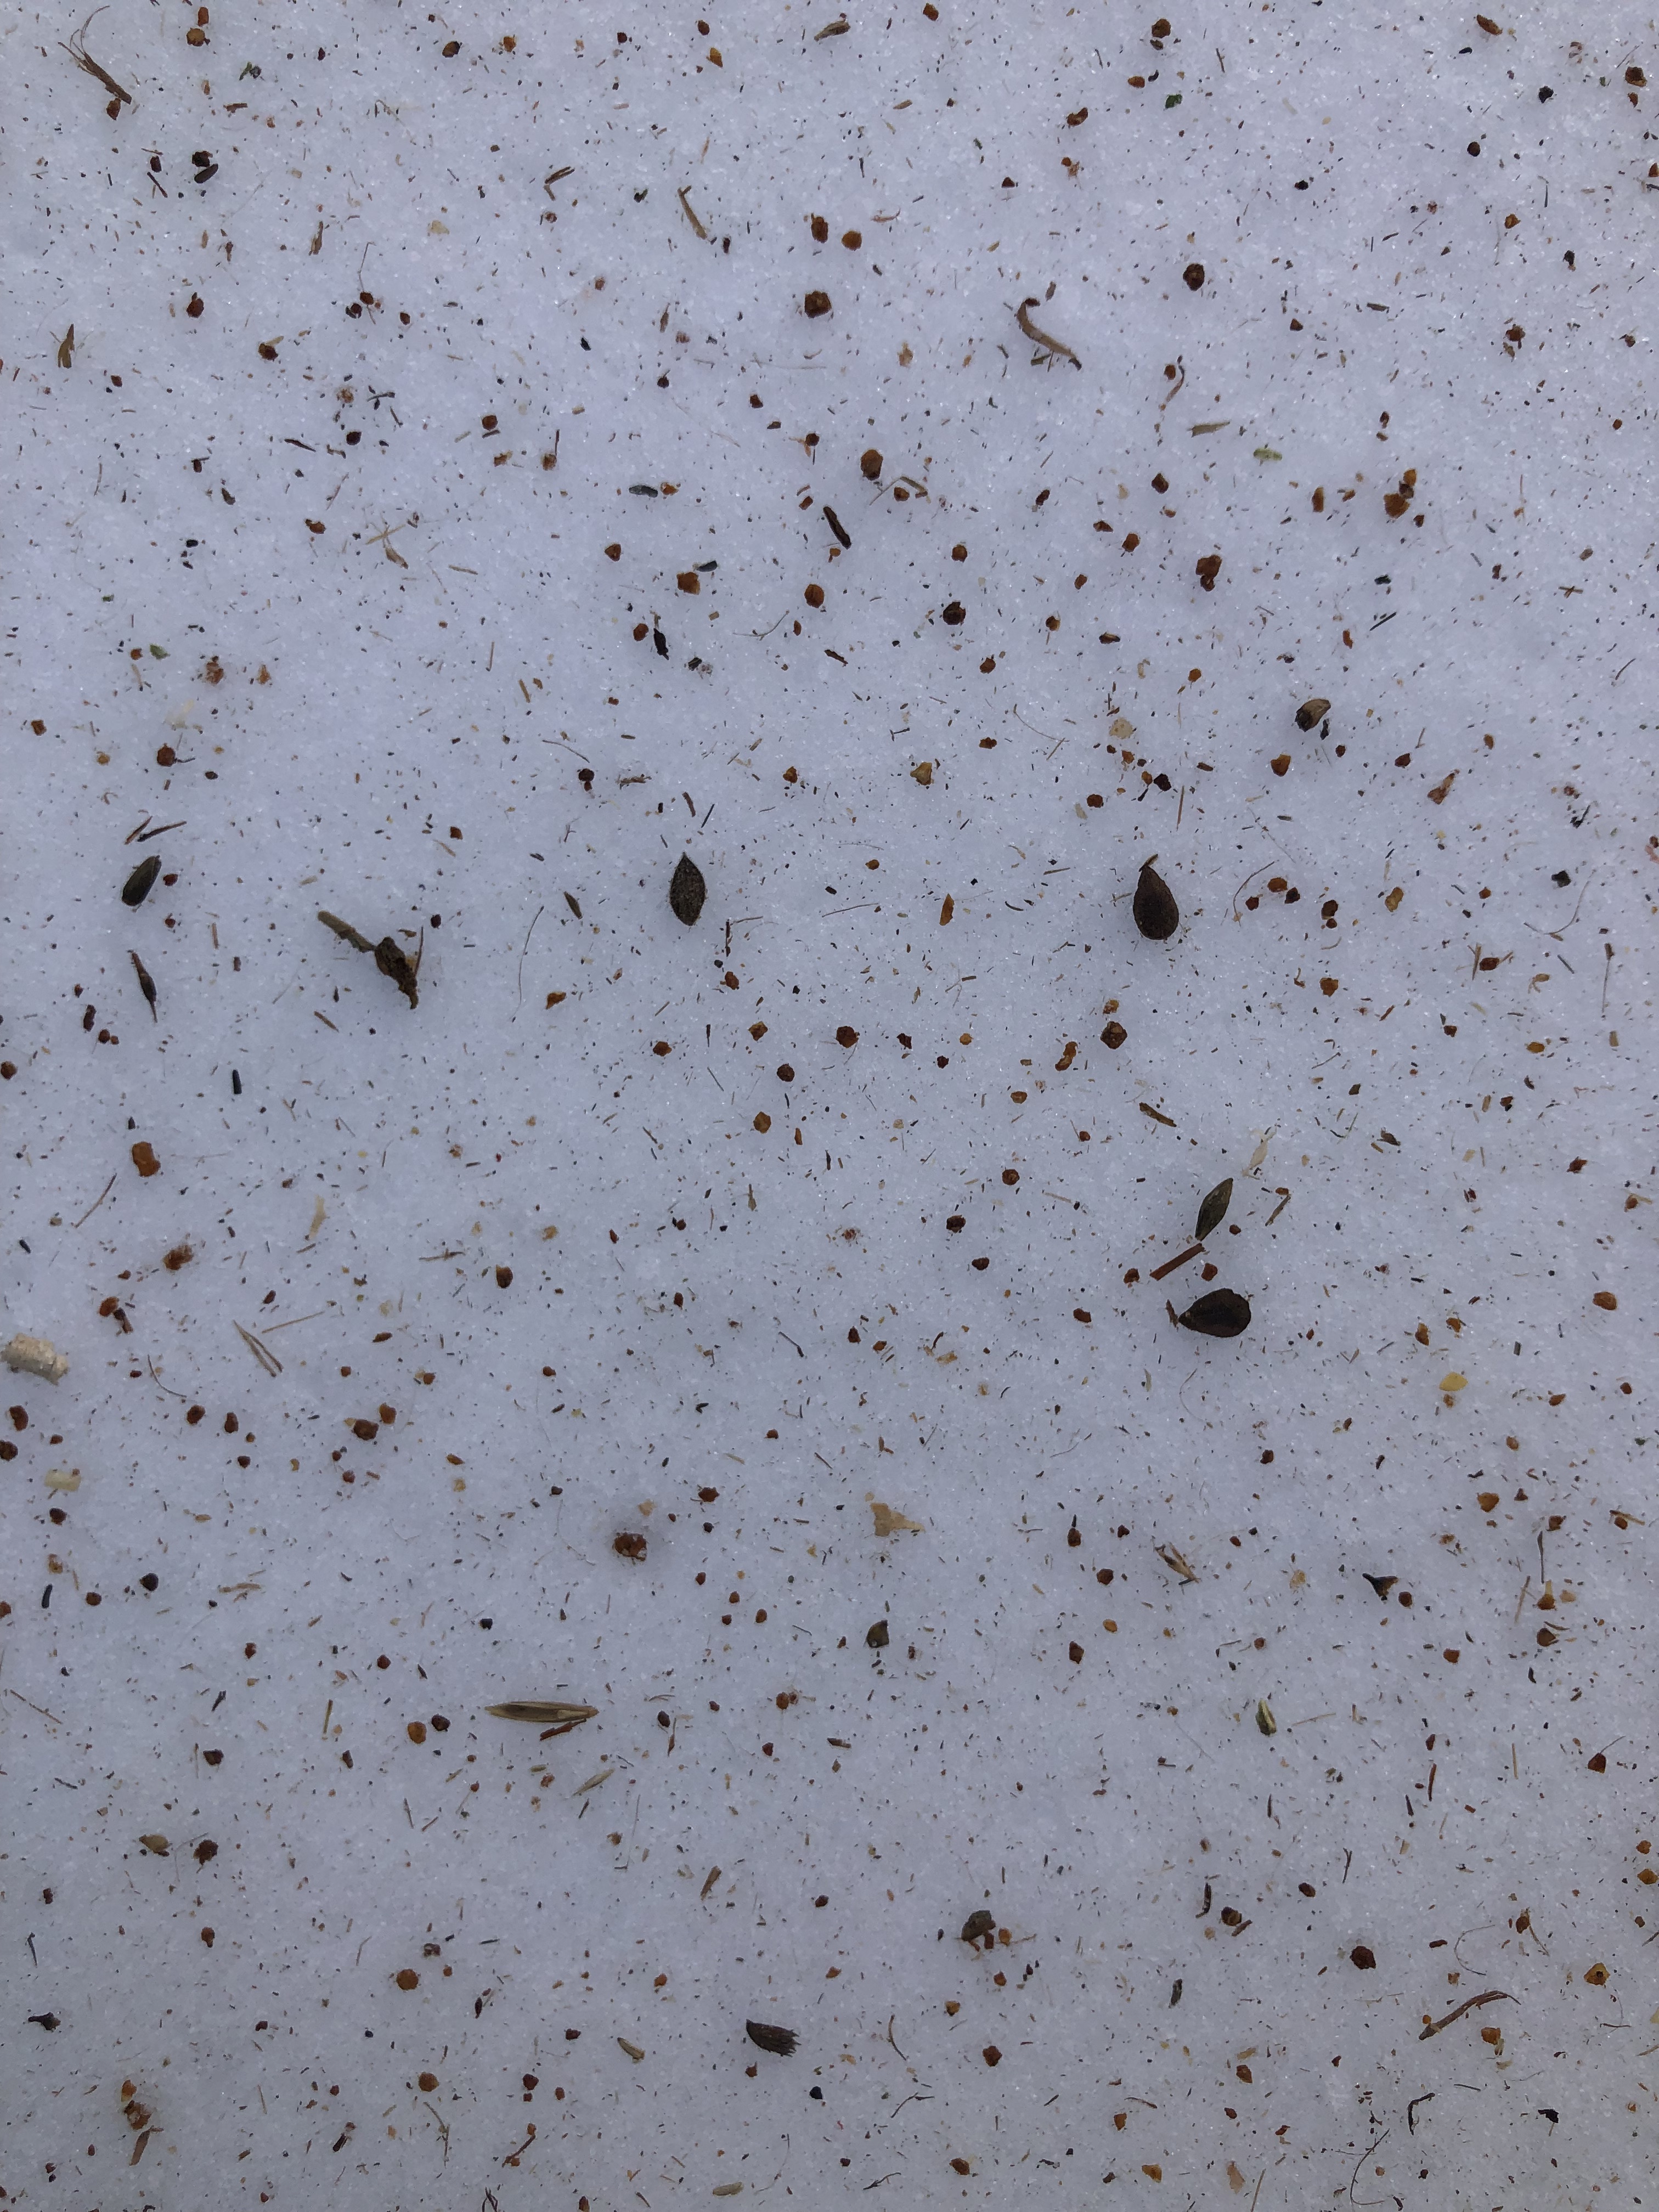
If not sowing into snow, consider driving your seeding unit over clean white paper to see the seeding rate and coverage:
We used 3 different seeders to plant 42-acres:
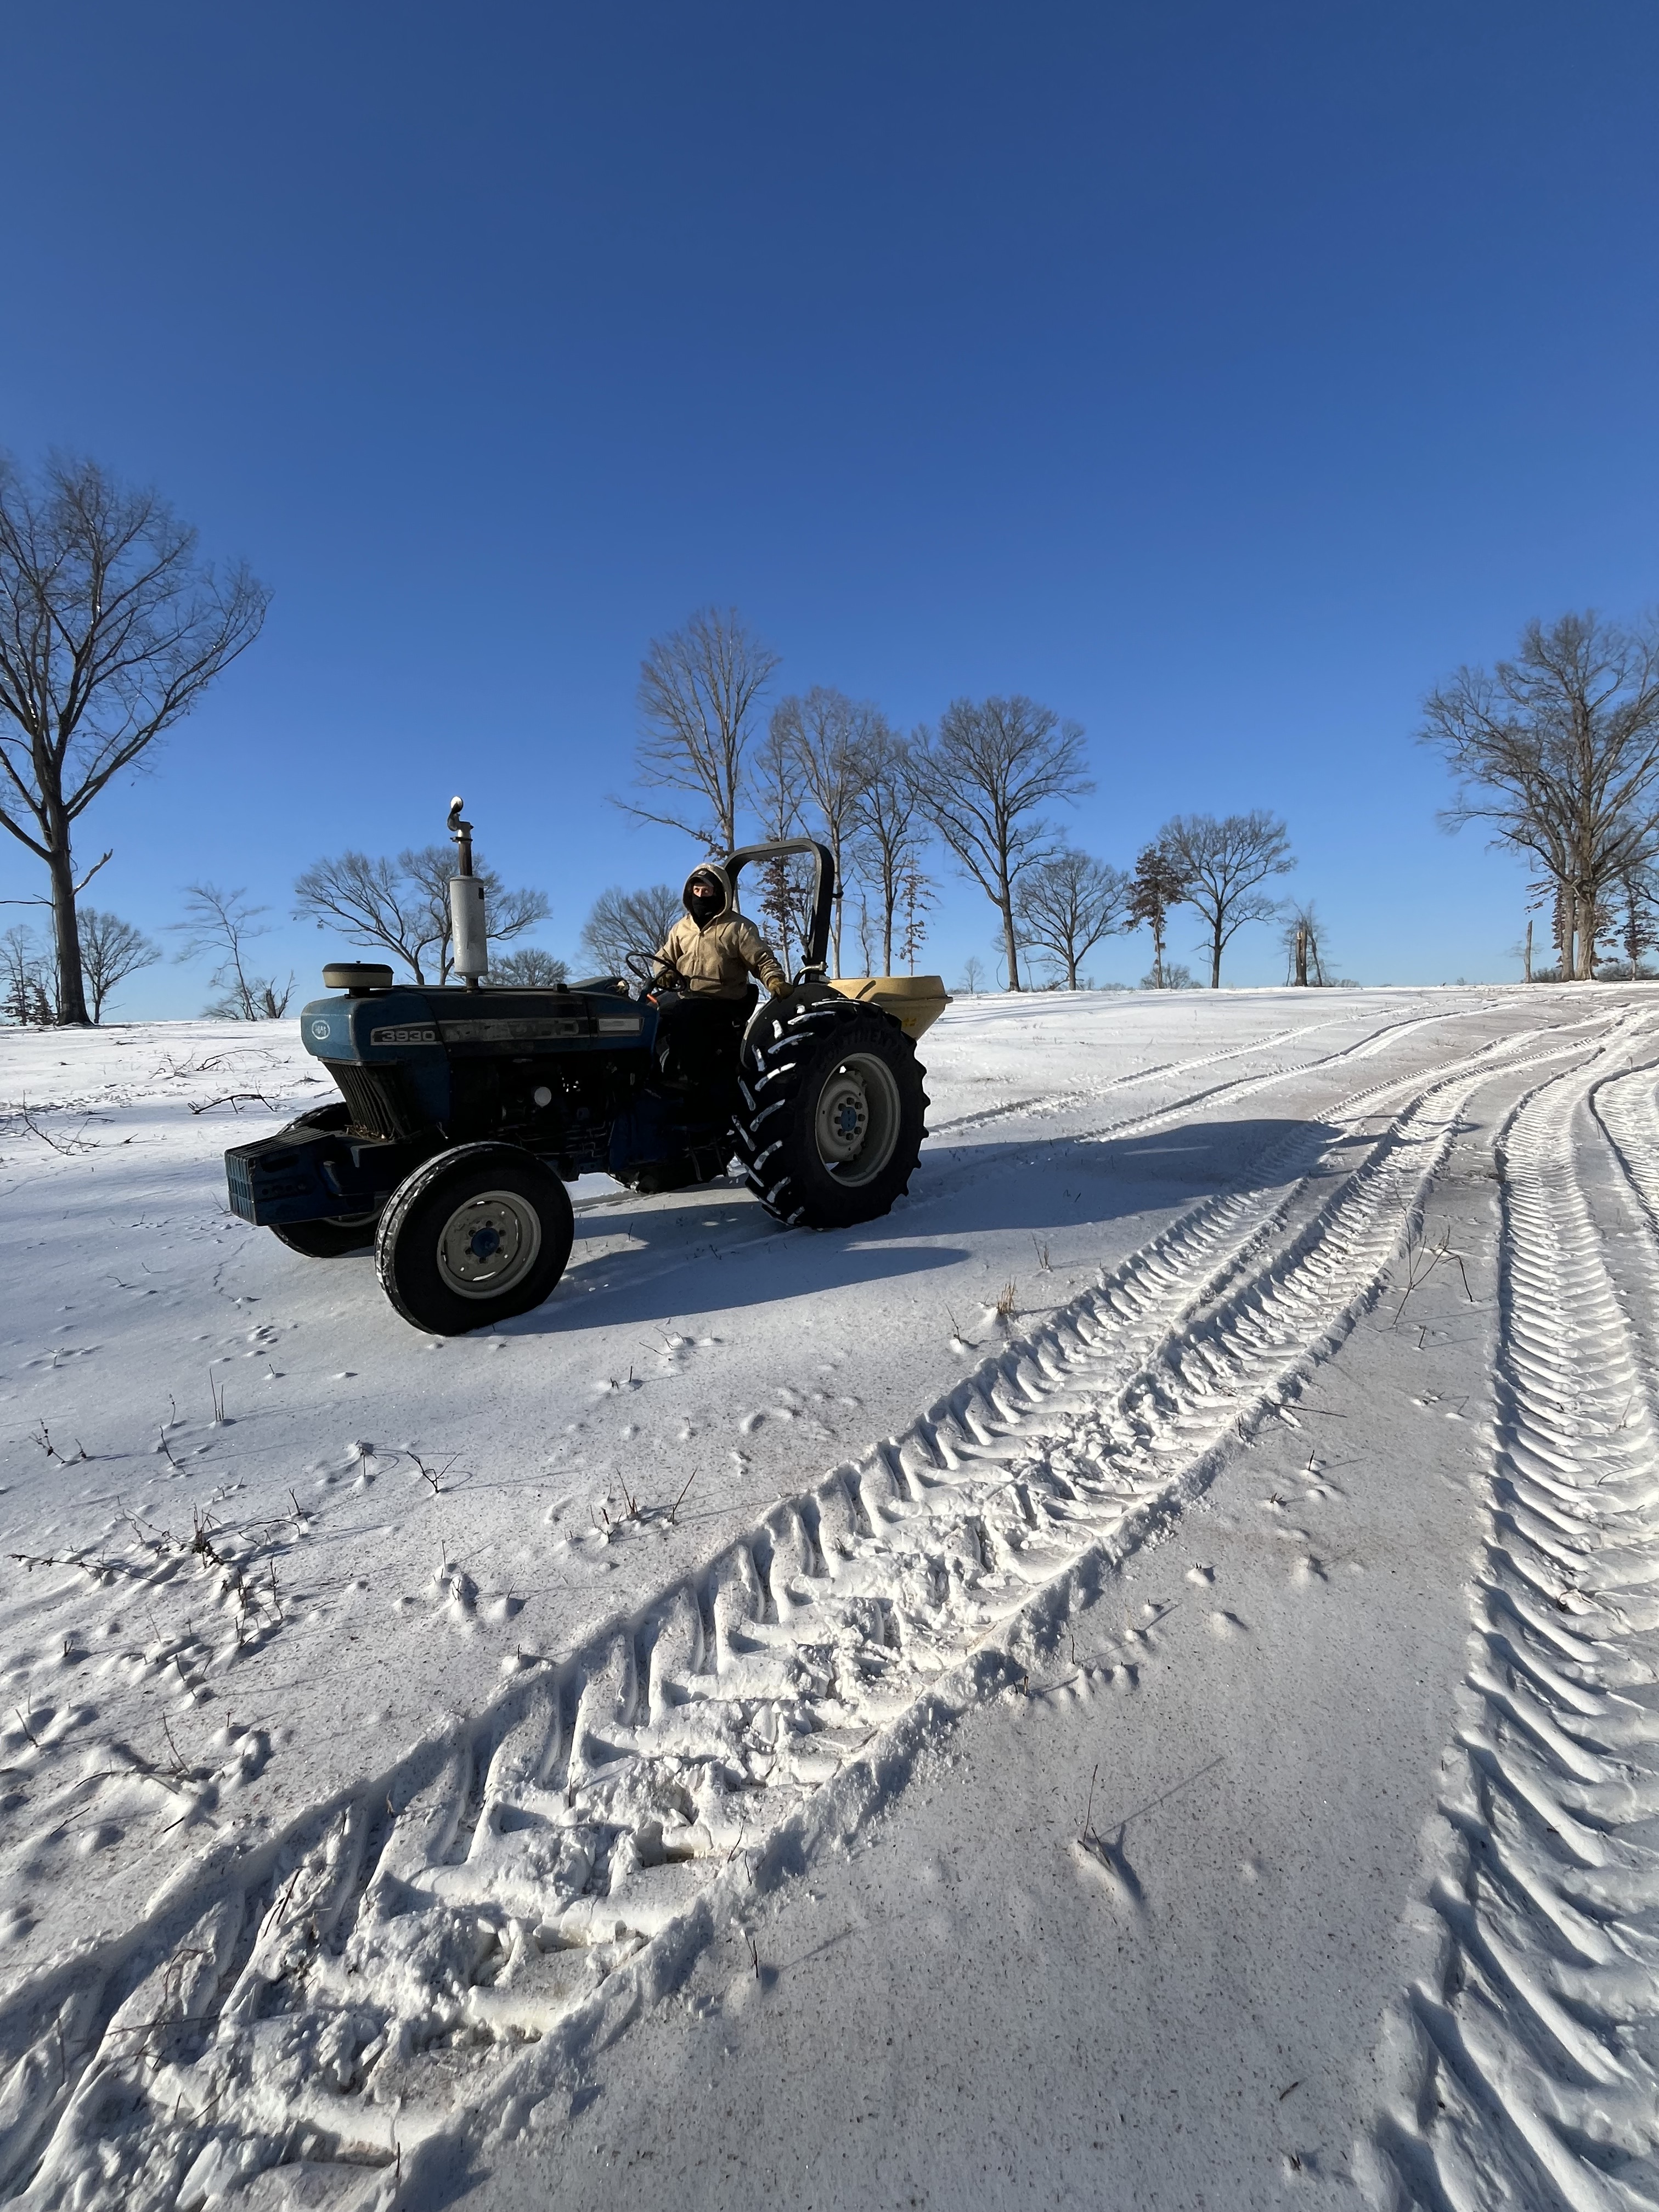
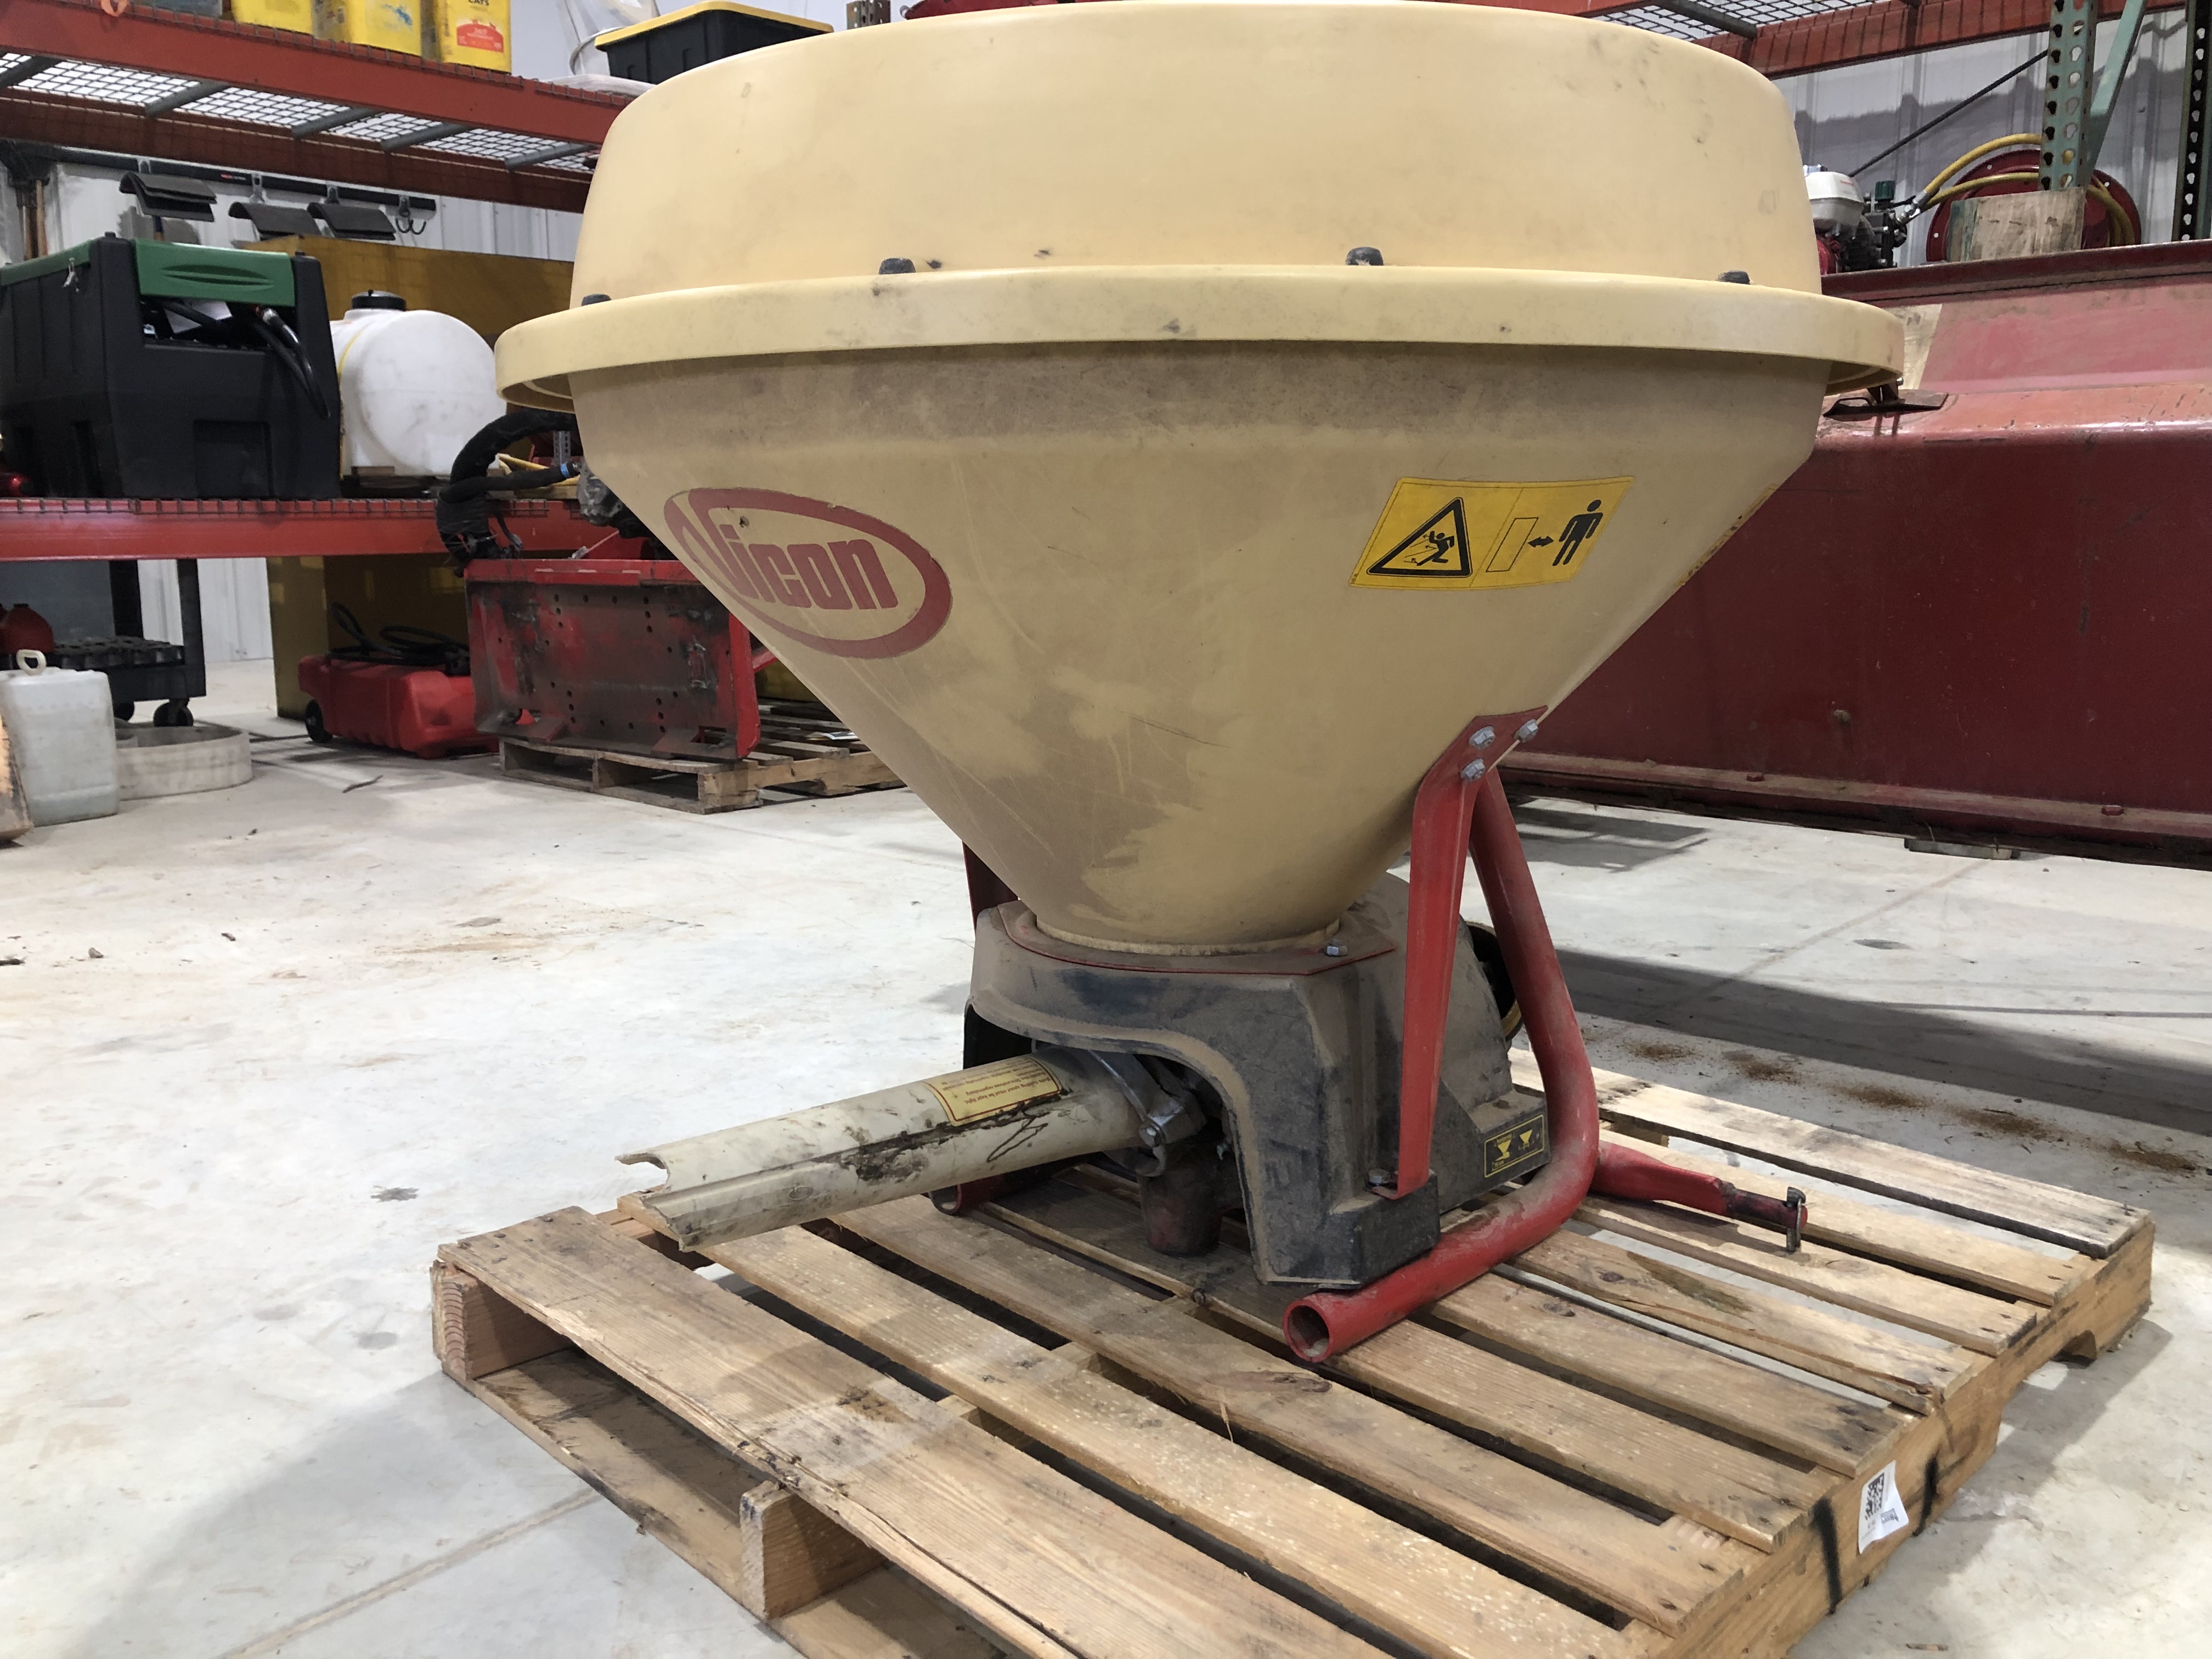
Vicon Pendulum – Tractor PTO – I ran this in Low-4 at 1,600 RPM. Most of my passes were at an aperture between 18 and 32. Pro: I love that the operator can easily open and close the aperture from the driver’s seat. It’s very nimble and has a good, even spread. Using a tractor is great because you can set the throttle and maintain a very consistent ground speed. The seeder is really hard to clog (our unit has an agitator) Cons: it’s cold with no cab! Also, the PTO continues to sling seed if you stop or slow down (unlike the pull behind units). The Mules can hold 5 barrels of seed, so you’re set for a few hours of seeding. With the Vicon, you have to refill frequently from a nearby trailer.
Nice tracks, even converage of seed. Vicon is now under the Kubota brand. A single pass with the aperture open to 24, Nice, even coverage.
Drop Seeders –
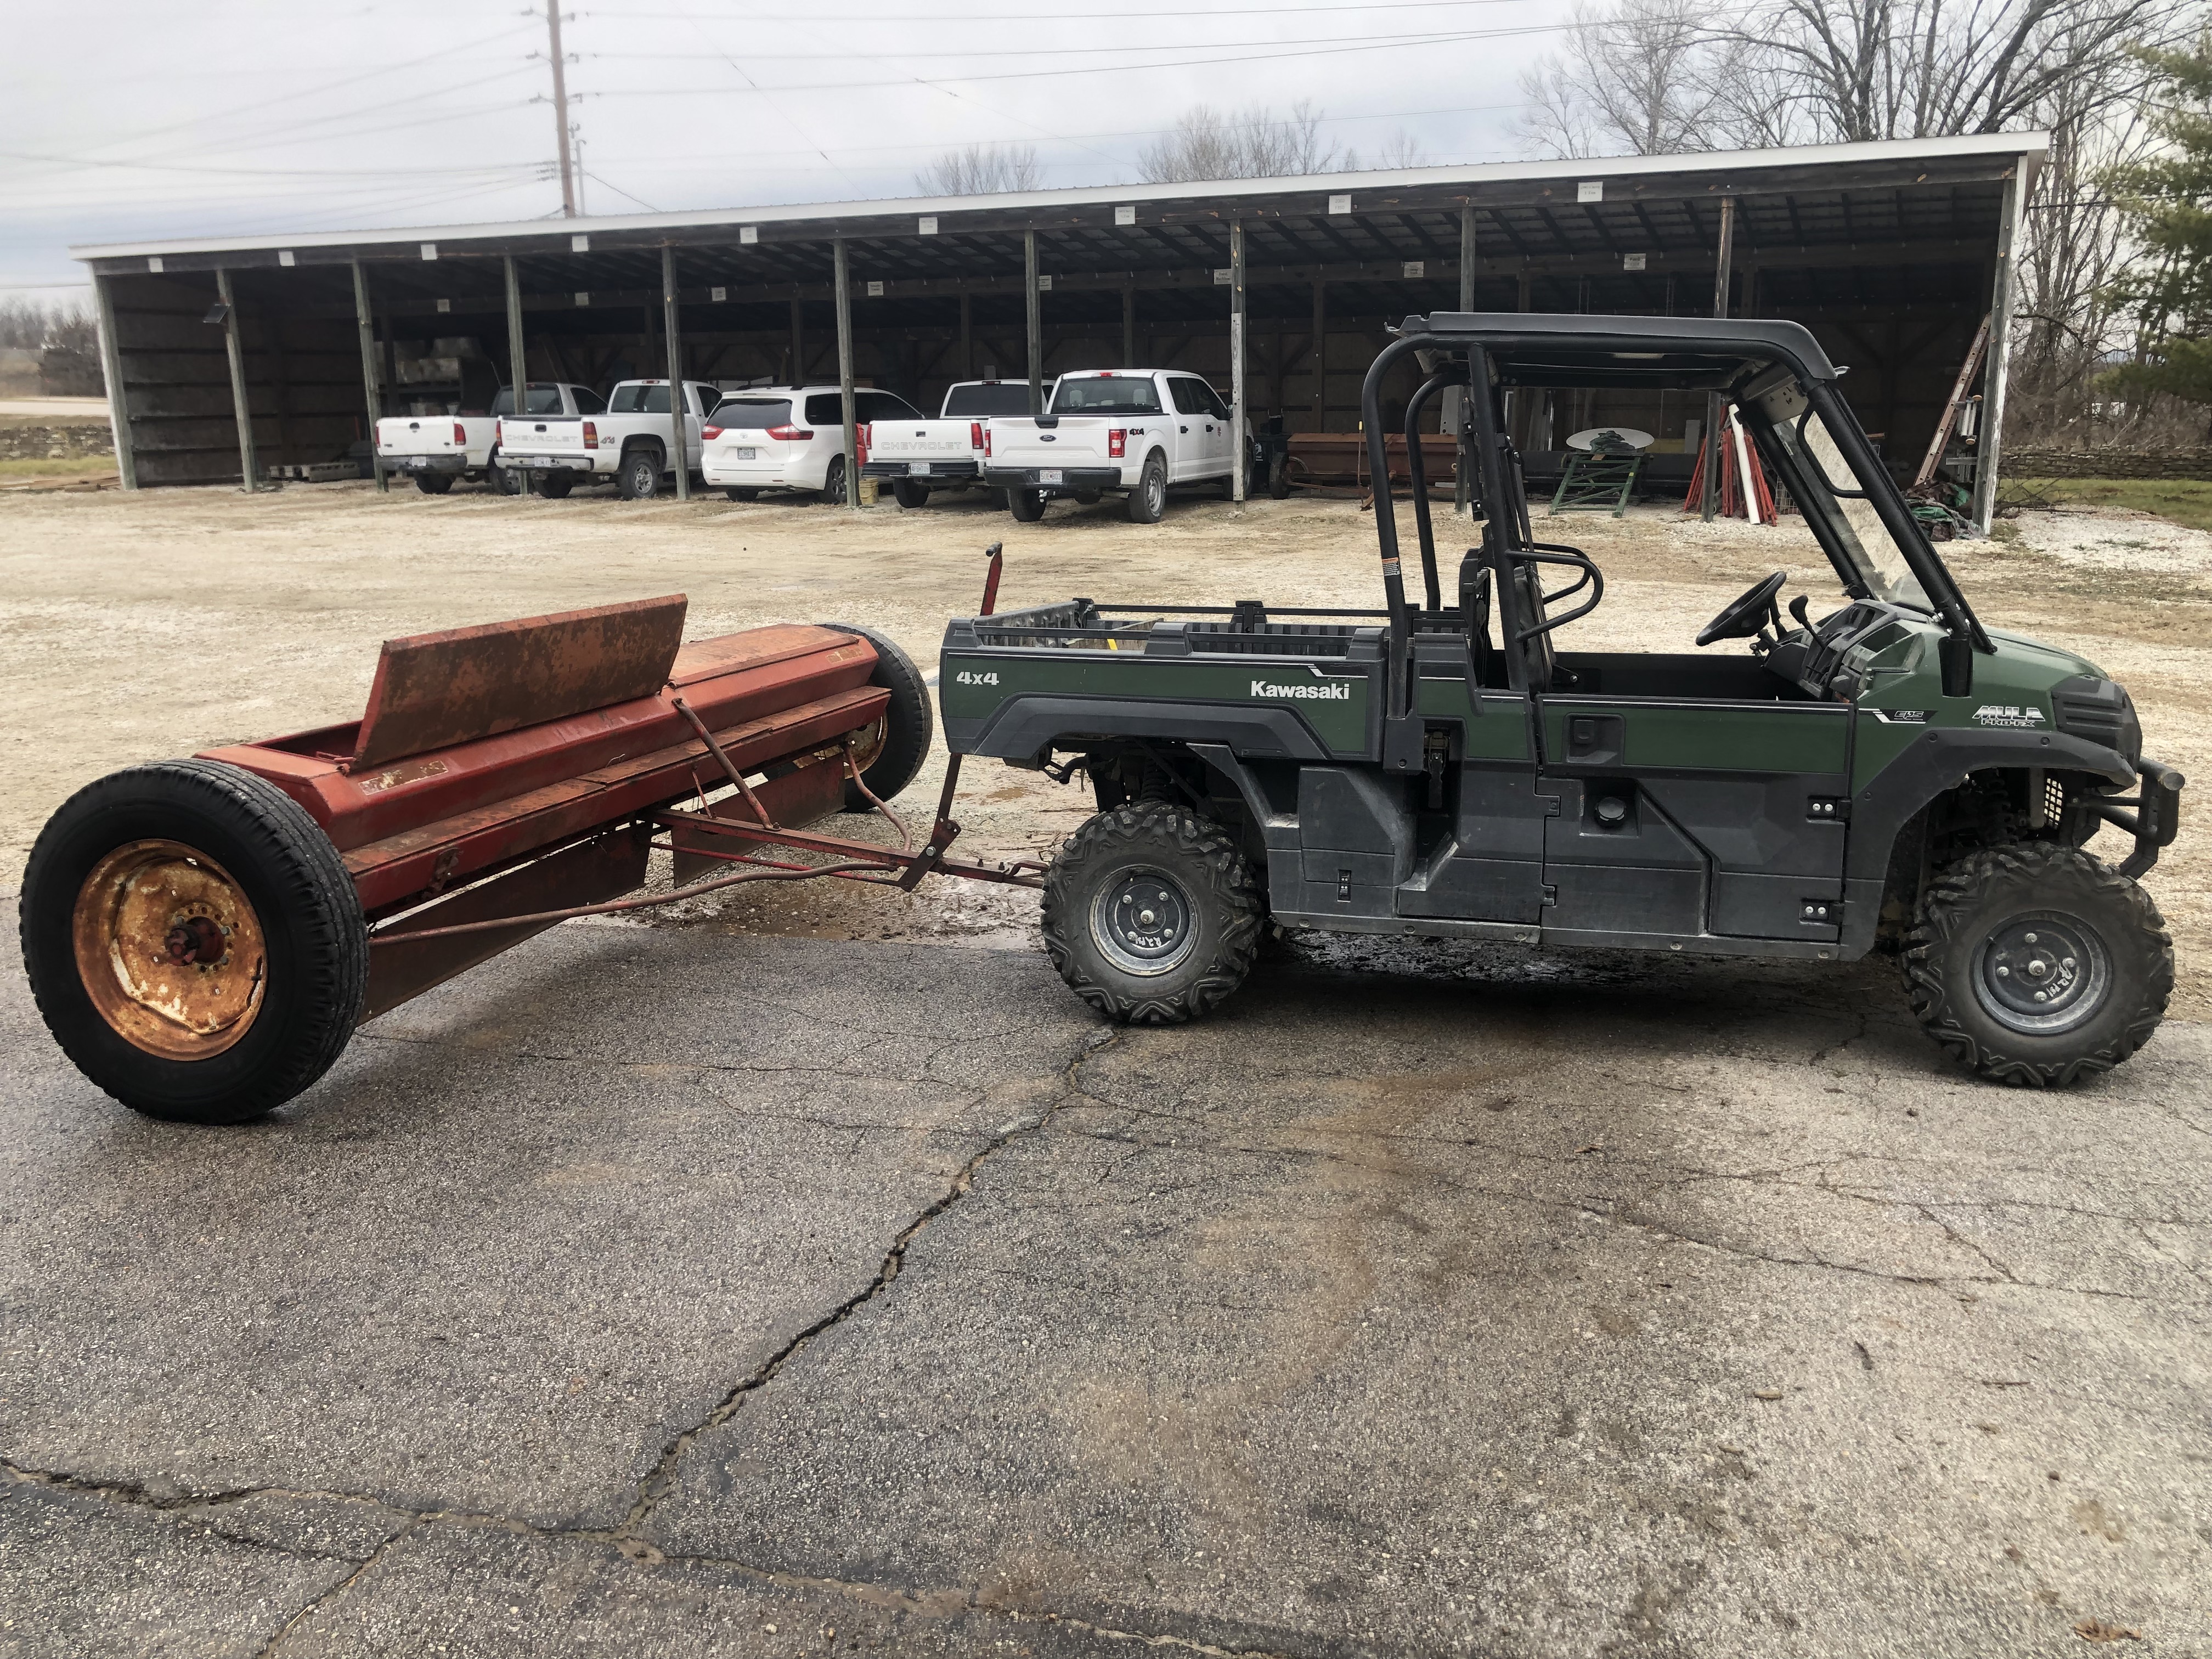
15ft wide International. Brought it for $750 or so off craigslist. Pulled by a Kawasaki mule pro fx. Most runs were at 70% open aperture. Pros: it is wide and covers a lot of ground. High ground clearance. Only drops seed when you’re moving. Offers a pretty uniform pattern. Holds about 2.5 barrels of seed. Cons: with tires, it’s 17ft wide! We have gates and culverts through/over which it cannot traverse. So we have to haul it out on a trailer and unloader/reload with a skid loader. Lots of effort to get it out and sowing ready.
With tires, 17ft wide!Big toothed auger really moves the seed.
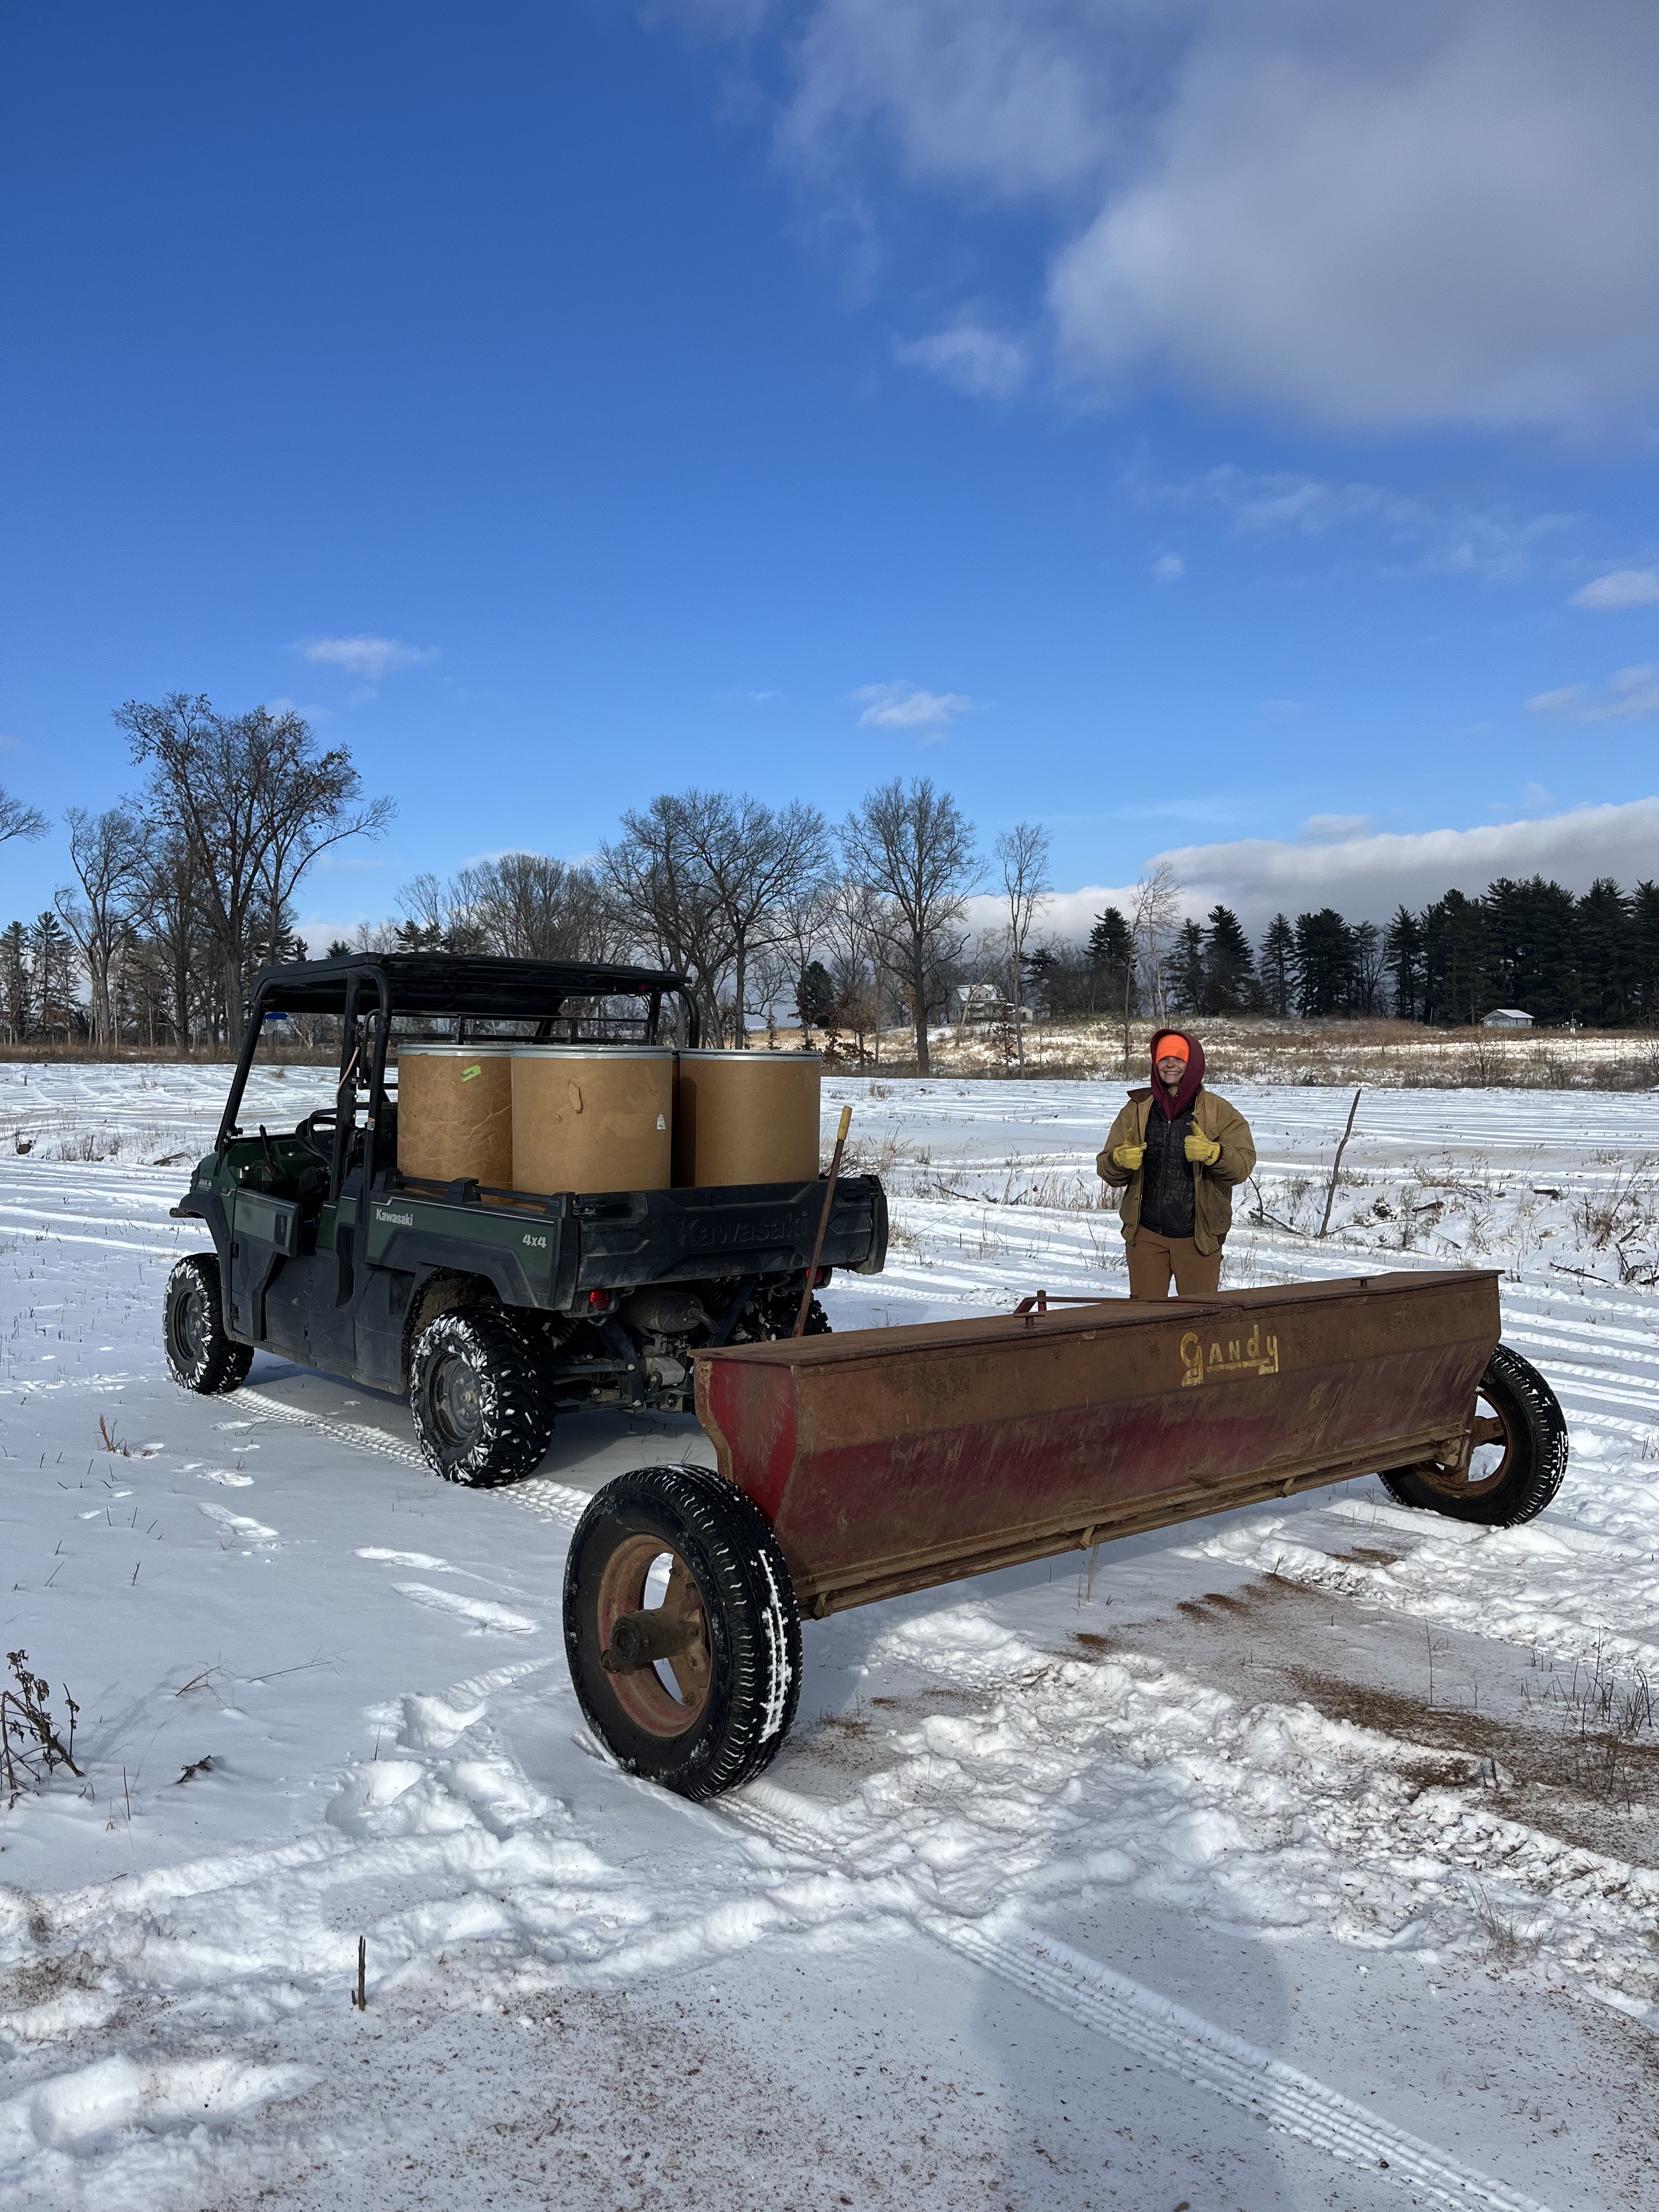
10ft wide Gandy. Bought if off Craigslist for $350. Very good condition, hand been stored inside. Came with new tires. Pro: at only 12 feet wide with tires, it easily passes through gates, over bridges and culverts. Fairly nimble, can navigate around trees. Con: I did not know when I purchased this that it is set up for pelleted, granular fertilizer. It does not have the big toothed auger. It really does not push through the chaffy seed like we want. Even with the aperture full open, not enough seed comes out. Possible fix: we’re going to affix some wide, sturdy zip ties to the auger and snip them short (1in) so that they’re stiff and rigid. We hope this will help push the seed out of the bottom of the seeder.
Auger not designed for fluffy, chaff-filled mix. Better suited for granular fertilizer.
Seed Filler – if you’ve ever bought pure live seed from a seed vendor, you then face the question of how to cut it, what filler to use, how do you make a small volume of pure seed cover many acres.
Last year we got some “seed trash” from a seed vendor. The “trash” is all of the chaff left over from their cleaning process. It’s a byproduct that does not have a lot of value to them. Pro: often times you can get it for free. Lots of volume, which is important if you’re trying to stretch out pure seed. Con: there is no guarantee that you do not get unwanted species like ashy sunflower, Johnson grass or lots of big bluestem or indian grass. Also, the “trash” can be really stemmy and you might have to process it further so that it’s clean/small enough to pass through your seeder.
Compass plant “trash”. Here I screen out the thickest stems (in pile on left). A lot of labor to net a relatively small amount of seed.
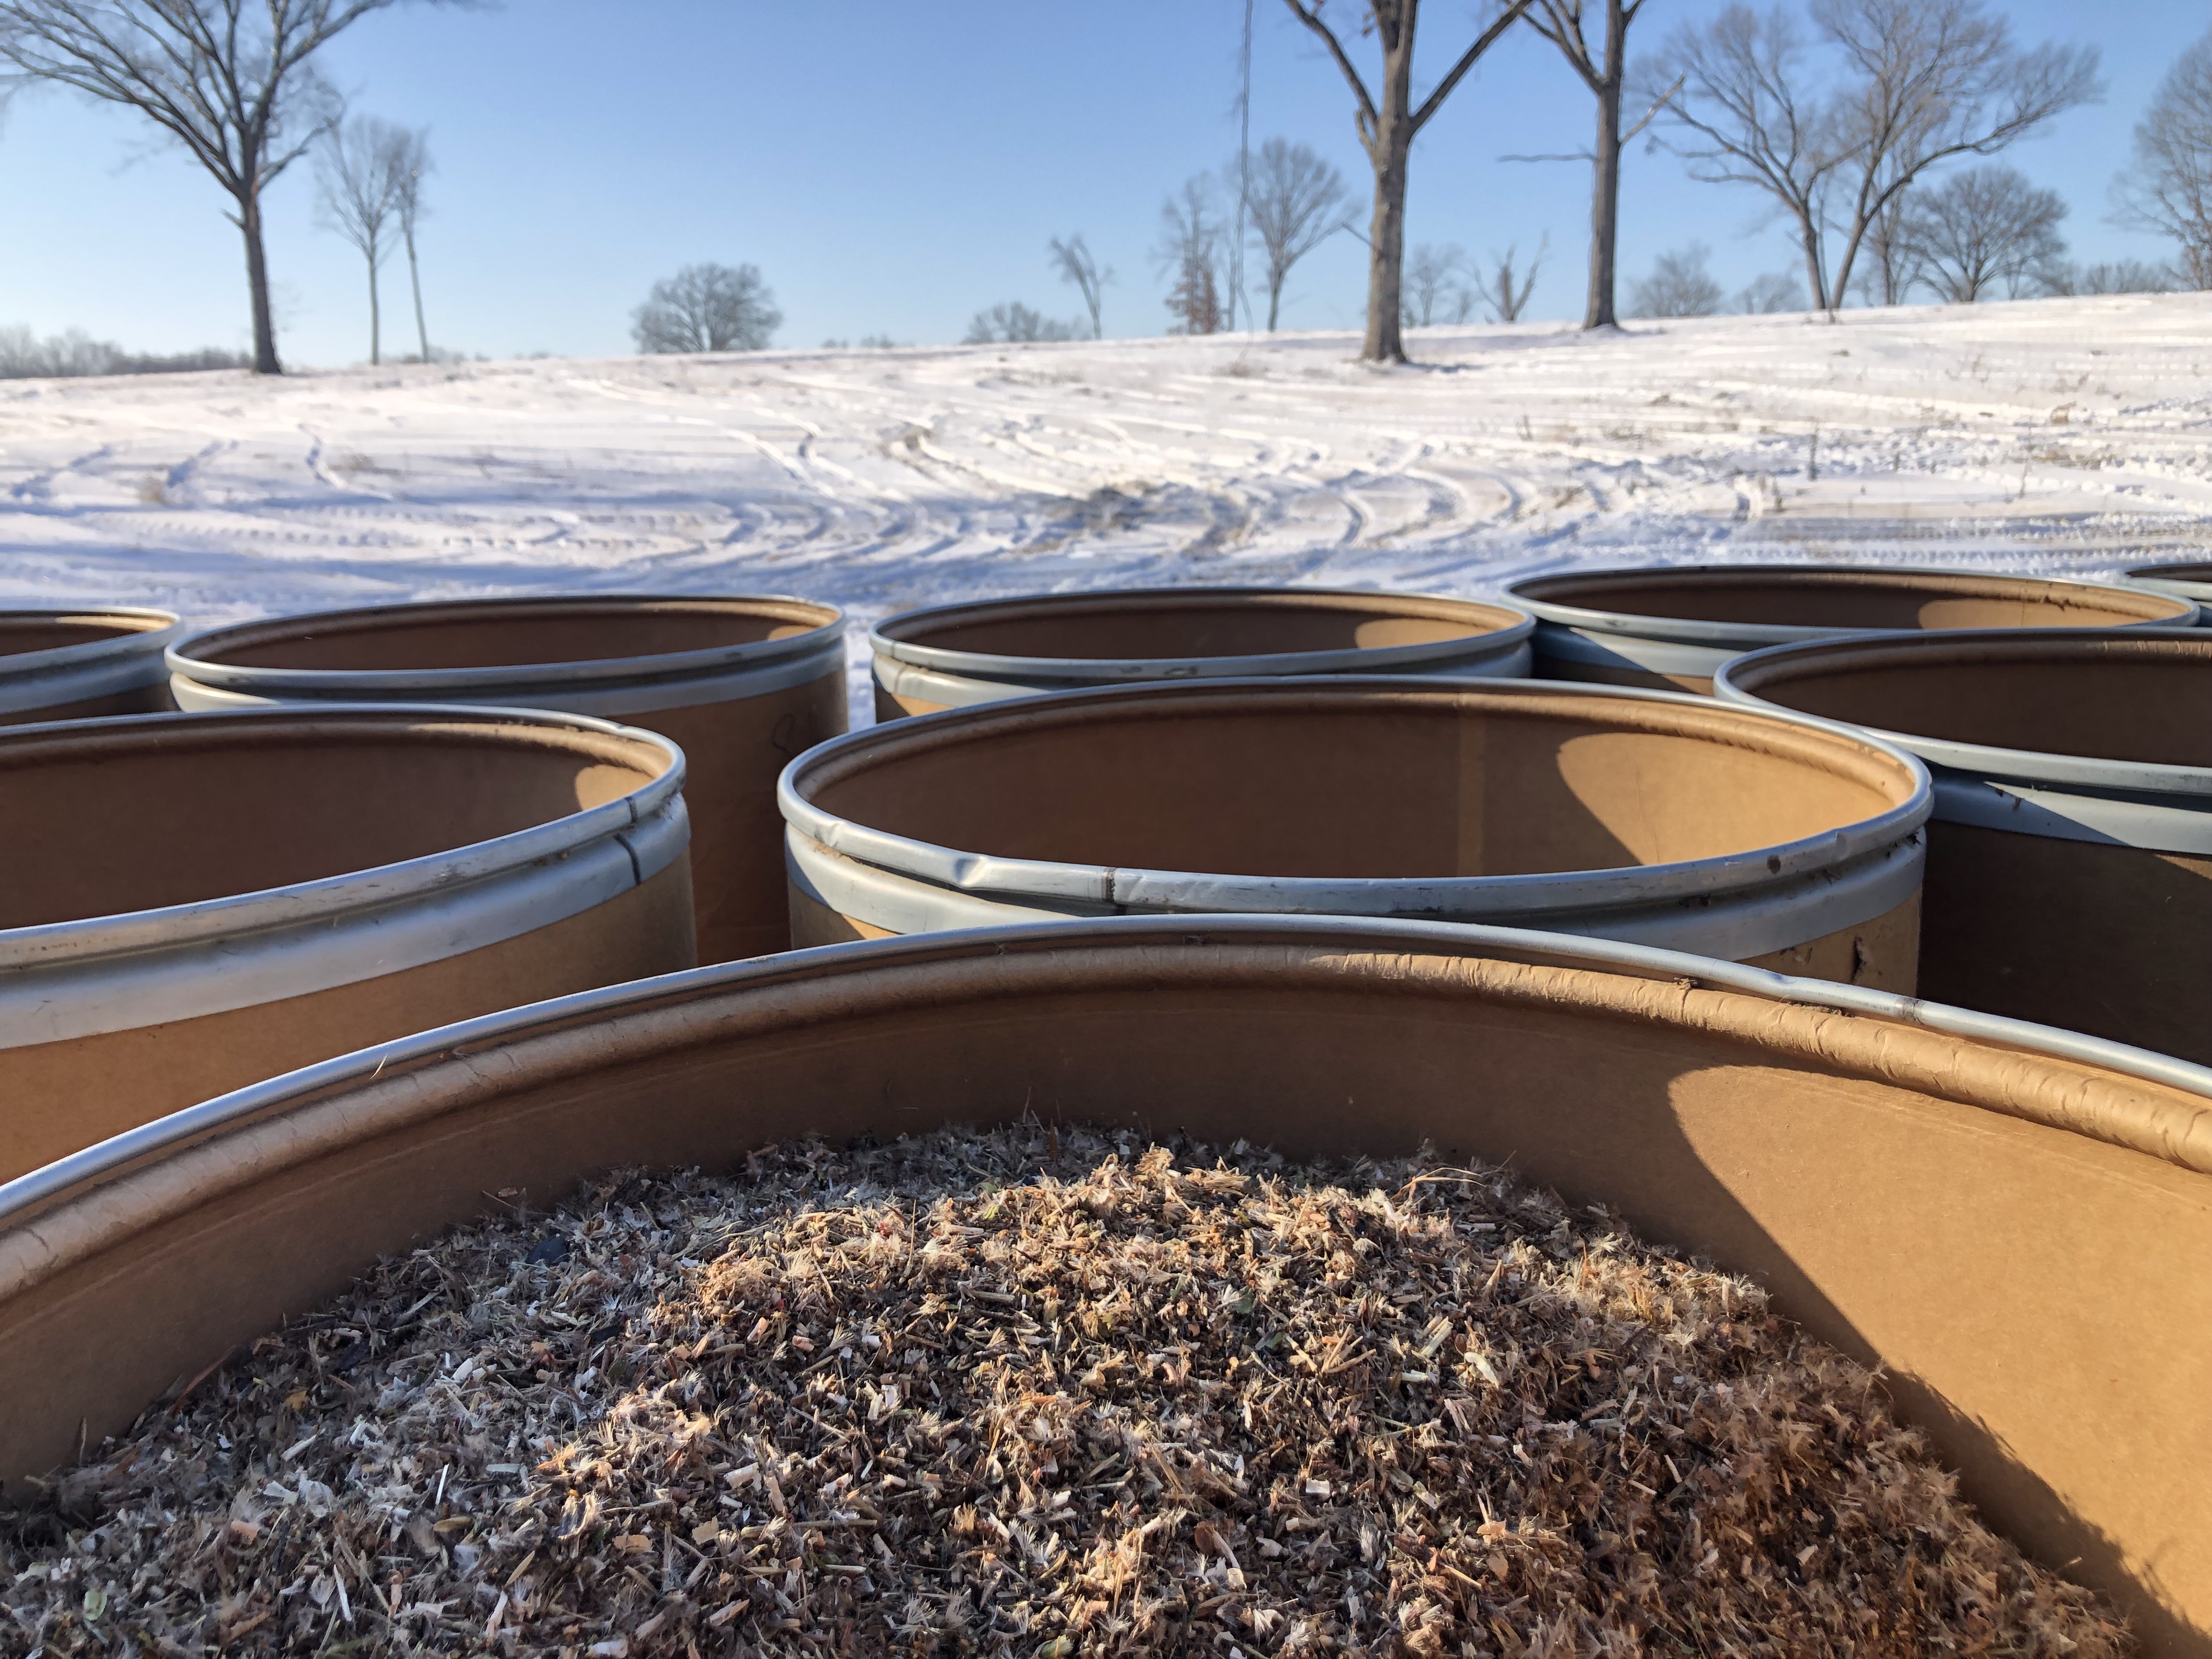
This year we purchased dried distiller’s grain from a big ag services company. 2,600 pounds for $300. Two cubic yard super sacks. Pro: not dusty at all. Even, uniform texture. Passed very easily through our seeders. Cons: very heavy! A “normal” barrel of milled mixed seed weights something like 50 pounds. Mixed seed with the distiller’s grain weighed around 100lbs. Took two people to load the seed into seeders. The material is very dense and sometimes settled to the bottom of the seeders maybe more than a fluffy chaffy might have. Did we get an uneven sowing?
Next year we might consider using rice hulls. Should be much lighter and still pretty cheap.
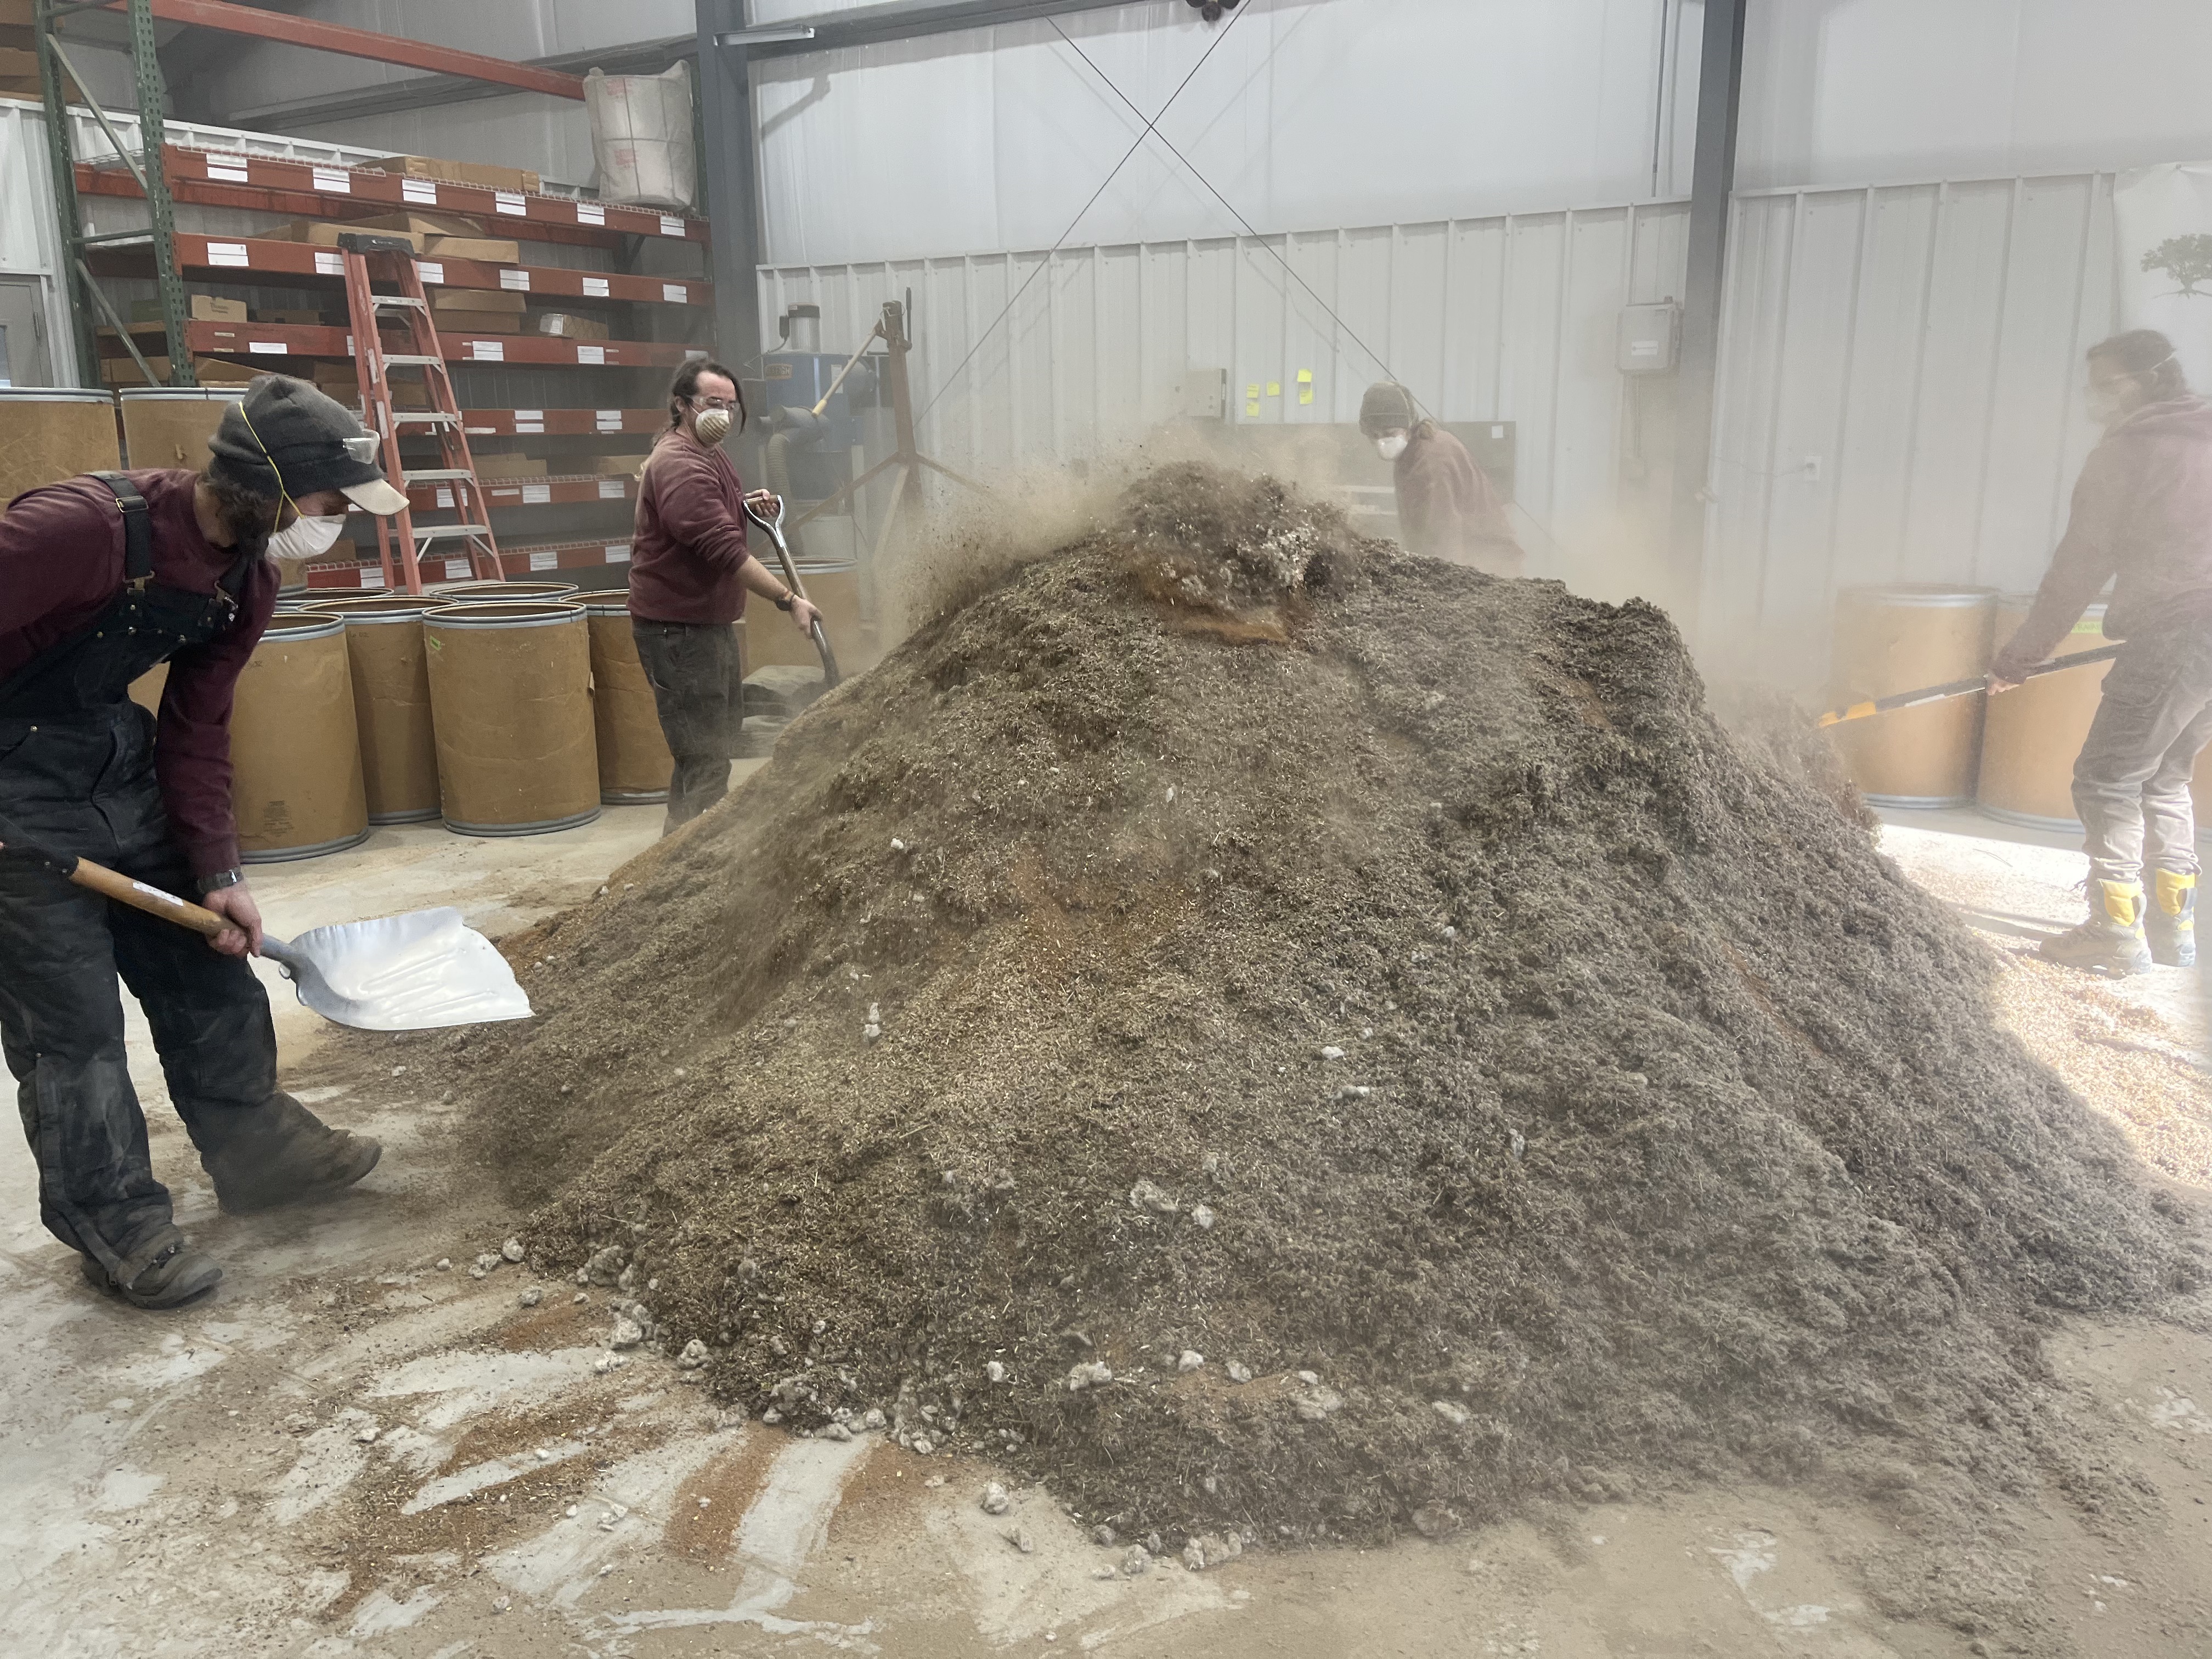
Mixing seed
Concrete floor is best. Mixing on a tarp works. Could we have used a skid loader bucket to churn seed? Maybe. Are there other ways to mix seed other than shovels and pitch forks, probably. Wear a mask and have exhausts fans!! Always, always label things clearly.
By: Julianne Mason, Ecological Management Supervisor, Forest Preserve District of Will County, Illinois
We have been using ESRI’s Field Maps app on our cell phones for natural resource management and monitoring data collection, and LOVING IT! For ecological management data, we have data layers and maps for invasive species treatments and observations, seed collection areas, native seed/plugs/woodies planted (areas and associated lists), prescribed burns, and deer culling. For monitoring data, we have wildlife, plant, and invertebrate observations, photo point monitoring, rare plant monitoring, turtle tracking data, small mammal trapping data, grassland bird monitoring, deer census data, and various other data sets. I absolutely love having so much good, organized, easily accessible ecological management information riding around in my pocket while I’m out in our preserves.
When was the last time this area was burned? … What did we seed here and when (species and seeding rates)? … When was the last time xxx species was observed here? … Where are the endangered turtles brumating? …
It’s great to have easy access to all this information in the field, and I think it helps us to make better, more informed decisions as ecologists and natural resource managers.
Paper maps and data collection in the old days (left). My favorite maps and data layers in the Field Maps app on my phone these days (right). So much great information is now available via the phone in my pocket!
As I mentioned in the first part of the post on prescribed burn monitoring, we have been using the Field Maps app to easily collect burn severity monitoring data as well as to document our prescribed burns. We collect the burn severity data from our permanent photo point locations. These permanent photo points are part of our rapid assessment vegetation monitoring, which tracks plant community changes over time. In the GIS structure, the burn monitoring table is related to the photo point locations.
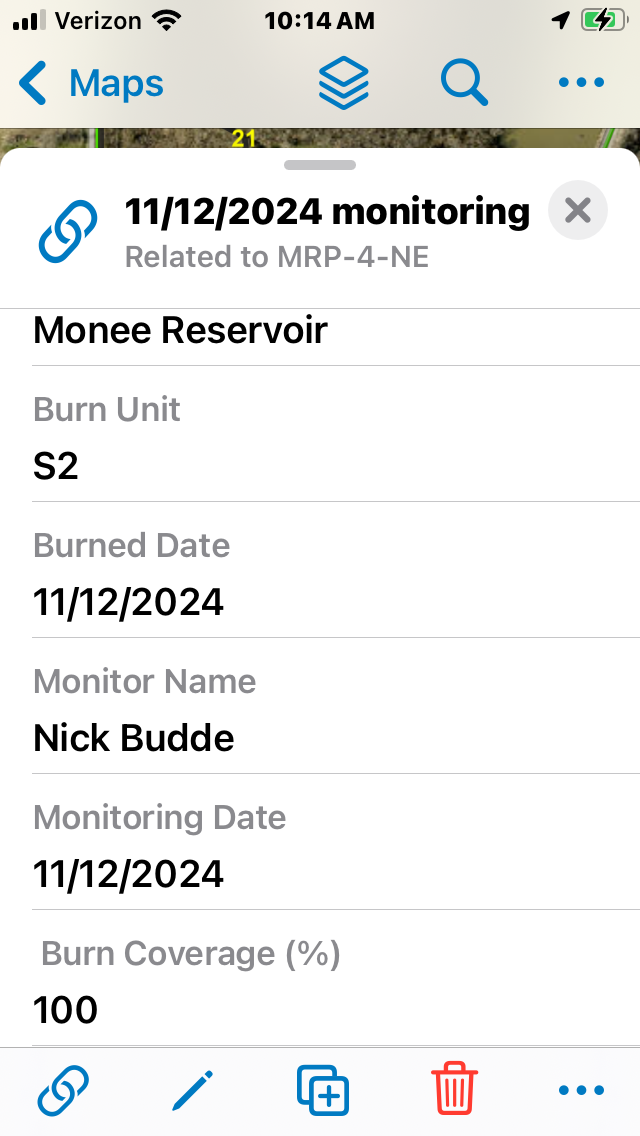
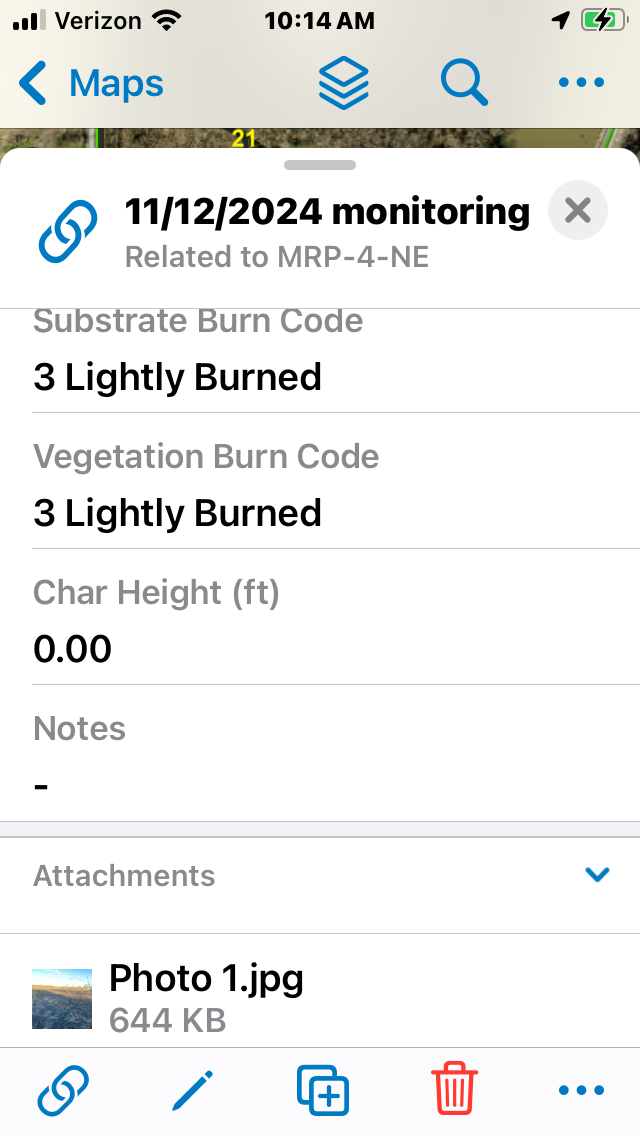
When we add burn monitoring data, we use pre-established drop downs to select the appropriate fire severity category and enter values for burn coverage and char height. Then, we take a photo through the app which links to that monitoring event and photo point location. It’s very user-friendly and fast!
Screen shots from my phone of burn severity monitoring data collected within ESRI’s Field Maps app.
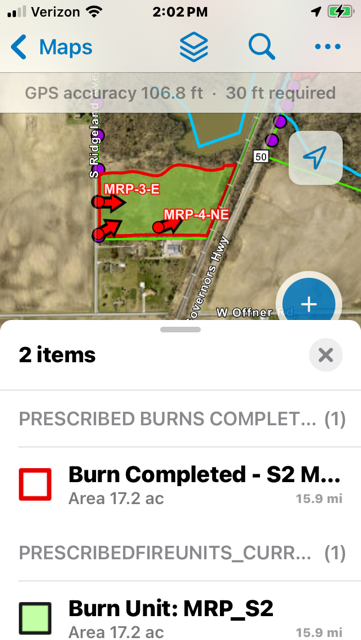
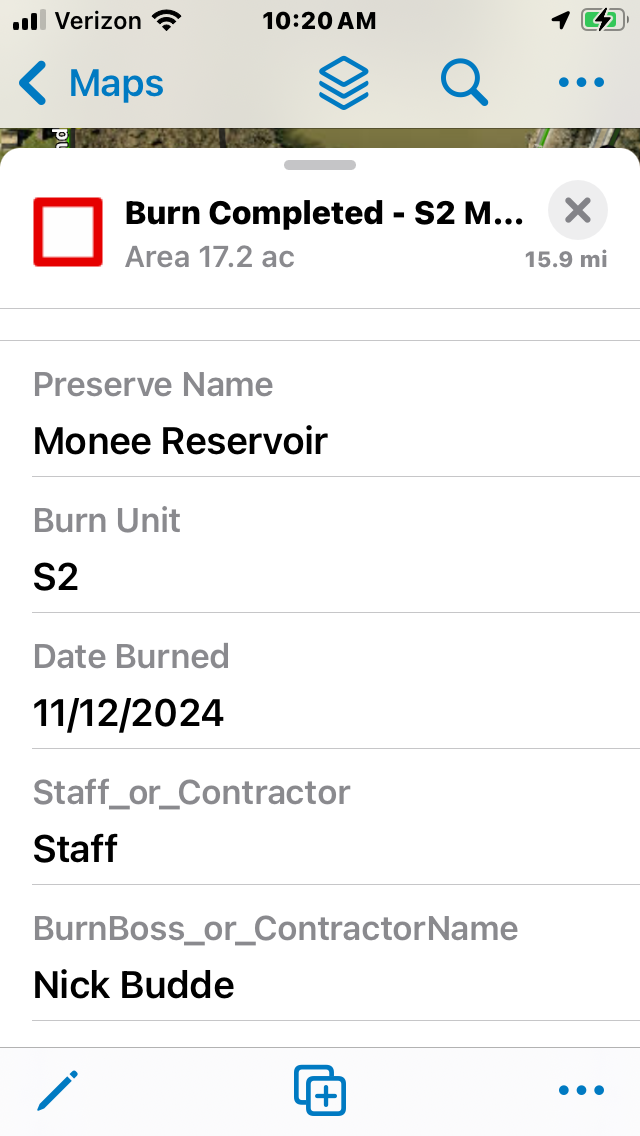
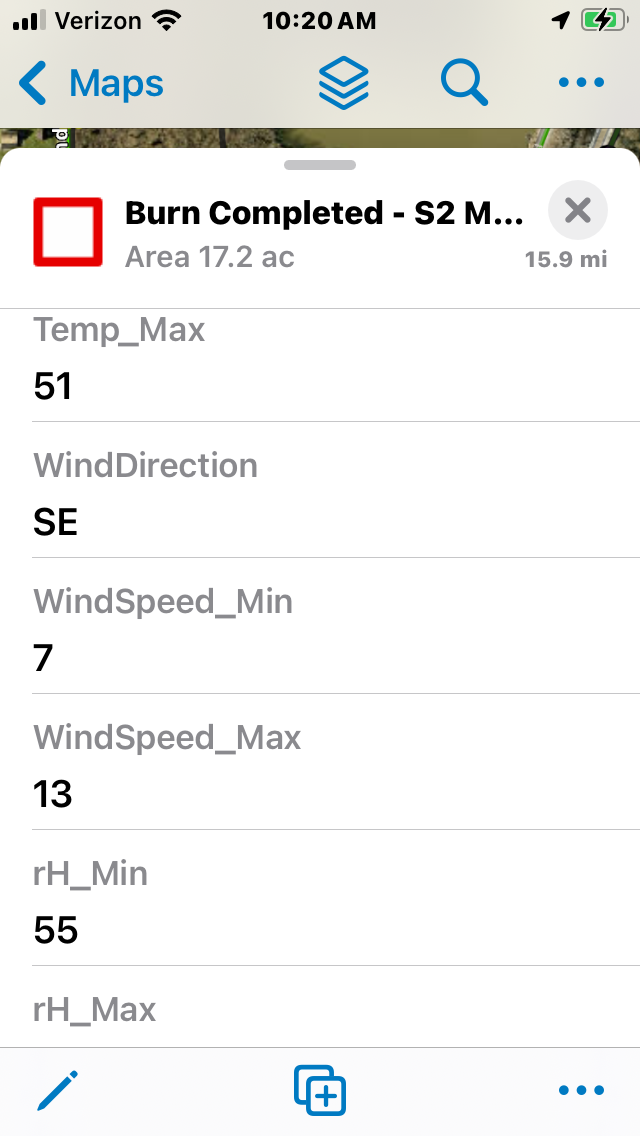
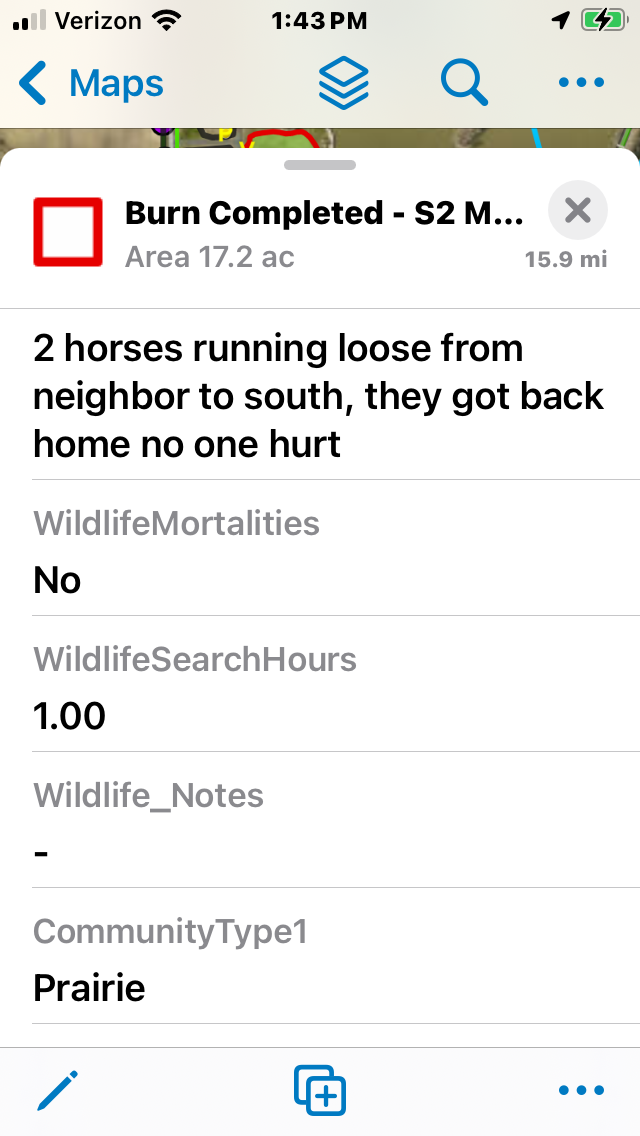
We also use Field Maps to document our prescribed burns completed. We can either copy the shape of an existing burn unit, or drawn in a new polygon to depict the area burned, and then enter information about the burn using the app. Our burn report includes basic data about the burn (e.g., unit name, date burned, burn boss name), weather data (e.g., temp, wind speed and direction, relative humidity, days since last precip), burn implementation data (crew size, start and end times, notes), wildlife mortalities and search effort, and fire effects (community type, flame lengths, percent burned, notes).
More screen shots from the Field Maps app on my phone for data entry of a prescribed burn completed.
In addition to using Field Maps for burn data collection, we have the following reference information loaded into our burn maps: burn notifications (contact names, agencies, phone numbers), fire districts, fire station locations, utility poles, pipeline locations, hazard locations, deer stand locations, fire break locations and status, way point locations, brush pile locations, prior burn history, preserve boundaries, trails, and waterway locations. So much great information!! My personal favorite is that I can tap on a dispatch phone number at the end of a long burn day when my eyes are full of smoke and not working well, and it automatically calls the number without me having to (mis)dial it! Yes, we are absolutely loving using Field Maps for prescribed burns.
Burn notifications are incorporated in our prescribed burn map in the Field Maps app. It’s fabulous to have all this data at our fingertips in the field!
Like any good system for data collection, it’s key to have a well structured and organized framework. Our data framework started with geodatabases created in ArcMap/ ArcPro that were published to ArcGIS online and then configured for field data entry. Field Maps makes the interface for configuring and using it in the field intuitive and easy. Our specific data categories, drop down lists, and information collected may not be precisely applicable to your organization, but in Field Maps they can be customized to meet your needs. I highly recommend using Field Maps to enter and access prescribed burn information!
We have upgraded our job description and increased the job category. So skip last weeks posting. Here is the text.
Nachusa Grasslands Restoration Ecologist (CP VI) – 55997 – The Restoration Ecologist develops, manages, and advances conservation programs, plans, and methods for small to medium scale geographic areas. The Ecologist addresses critical threats to natural systems and individual species, fosters cross-site learning among conservation community, and supplies conservation planning teams with site or landscape level information relevant to the planning process. Additional tasks include activities associated with bison management, interfacing with scientific research, along with maintaining and setting up for events for visitors and members, repairing and towing equipment, and mentoring others in various tasks. Financial responsibility may include working within a budget to complete projects, negotiating and contracting with vendors, assisting with budget development and fundraising targets. This position is onsite at Nachusa Grasslands near Dixon, IL and this position will close once a strong applicant pool is identified. For more details and to apply, please visit https://careers.nature.org/ and search for Nachusa or Job ID 55997.
Part 2 – Why Bother Doing Prescribed Burn Monitoring
By: Julianne Mason, Ecological Management Supervisor, Forest Preserve District of Will County, Illinois
The ecological effects of prescribed burns can vary a lot depending on seasonality, frequency, and fire intensity. In recent years, we have been using a standardized protocol to monitor the intensity of prescribed burns. See Part 1 of this blog post for details. Basically, it combines taking post-burn photos from permanent photo point locations with recording the percent burn coverage, average char height, and fire intensity category in the vegetation and substrate layers. By doing standardized monitoring to characterize burn intensity, it gives us a more nuanced way to assess how prescribed burns are affecting plant communities.
Prescribed burns can vary a lot in intensity depending on weather conditions (relative humidity, temperature, wind speed), fuel moisture levels, fuel model type (grassland vs woodland), and firing techniques (backing, flanking, or headfires).
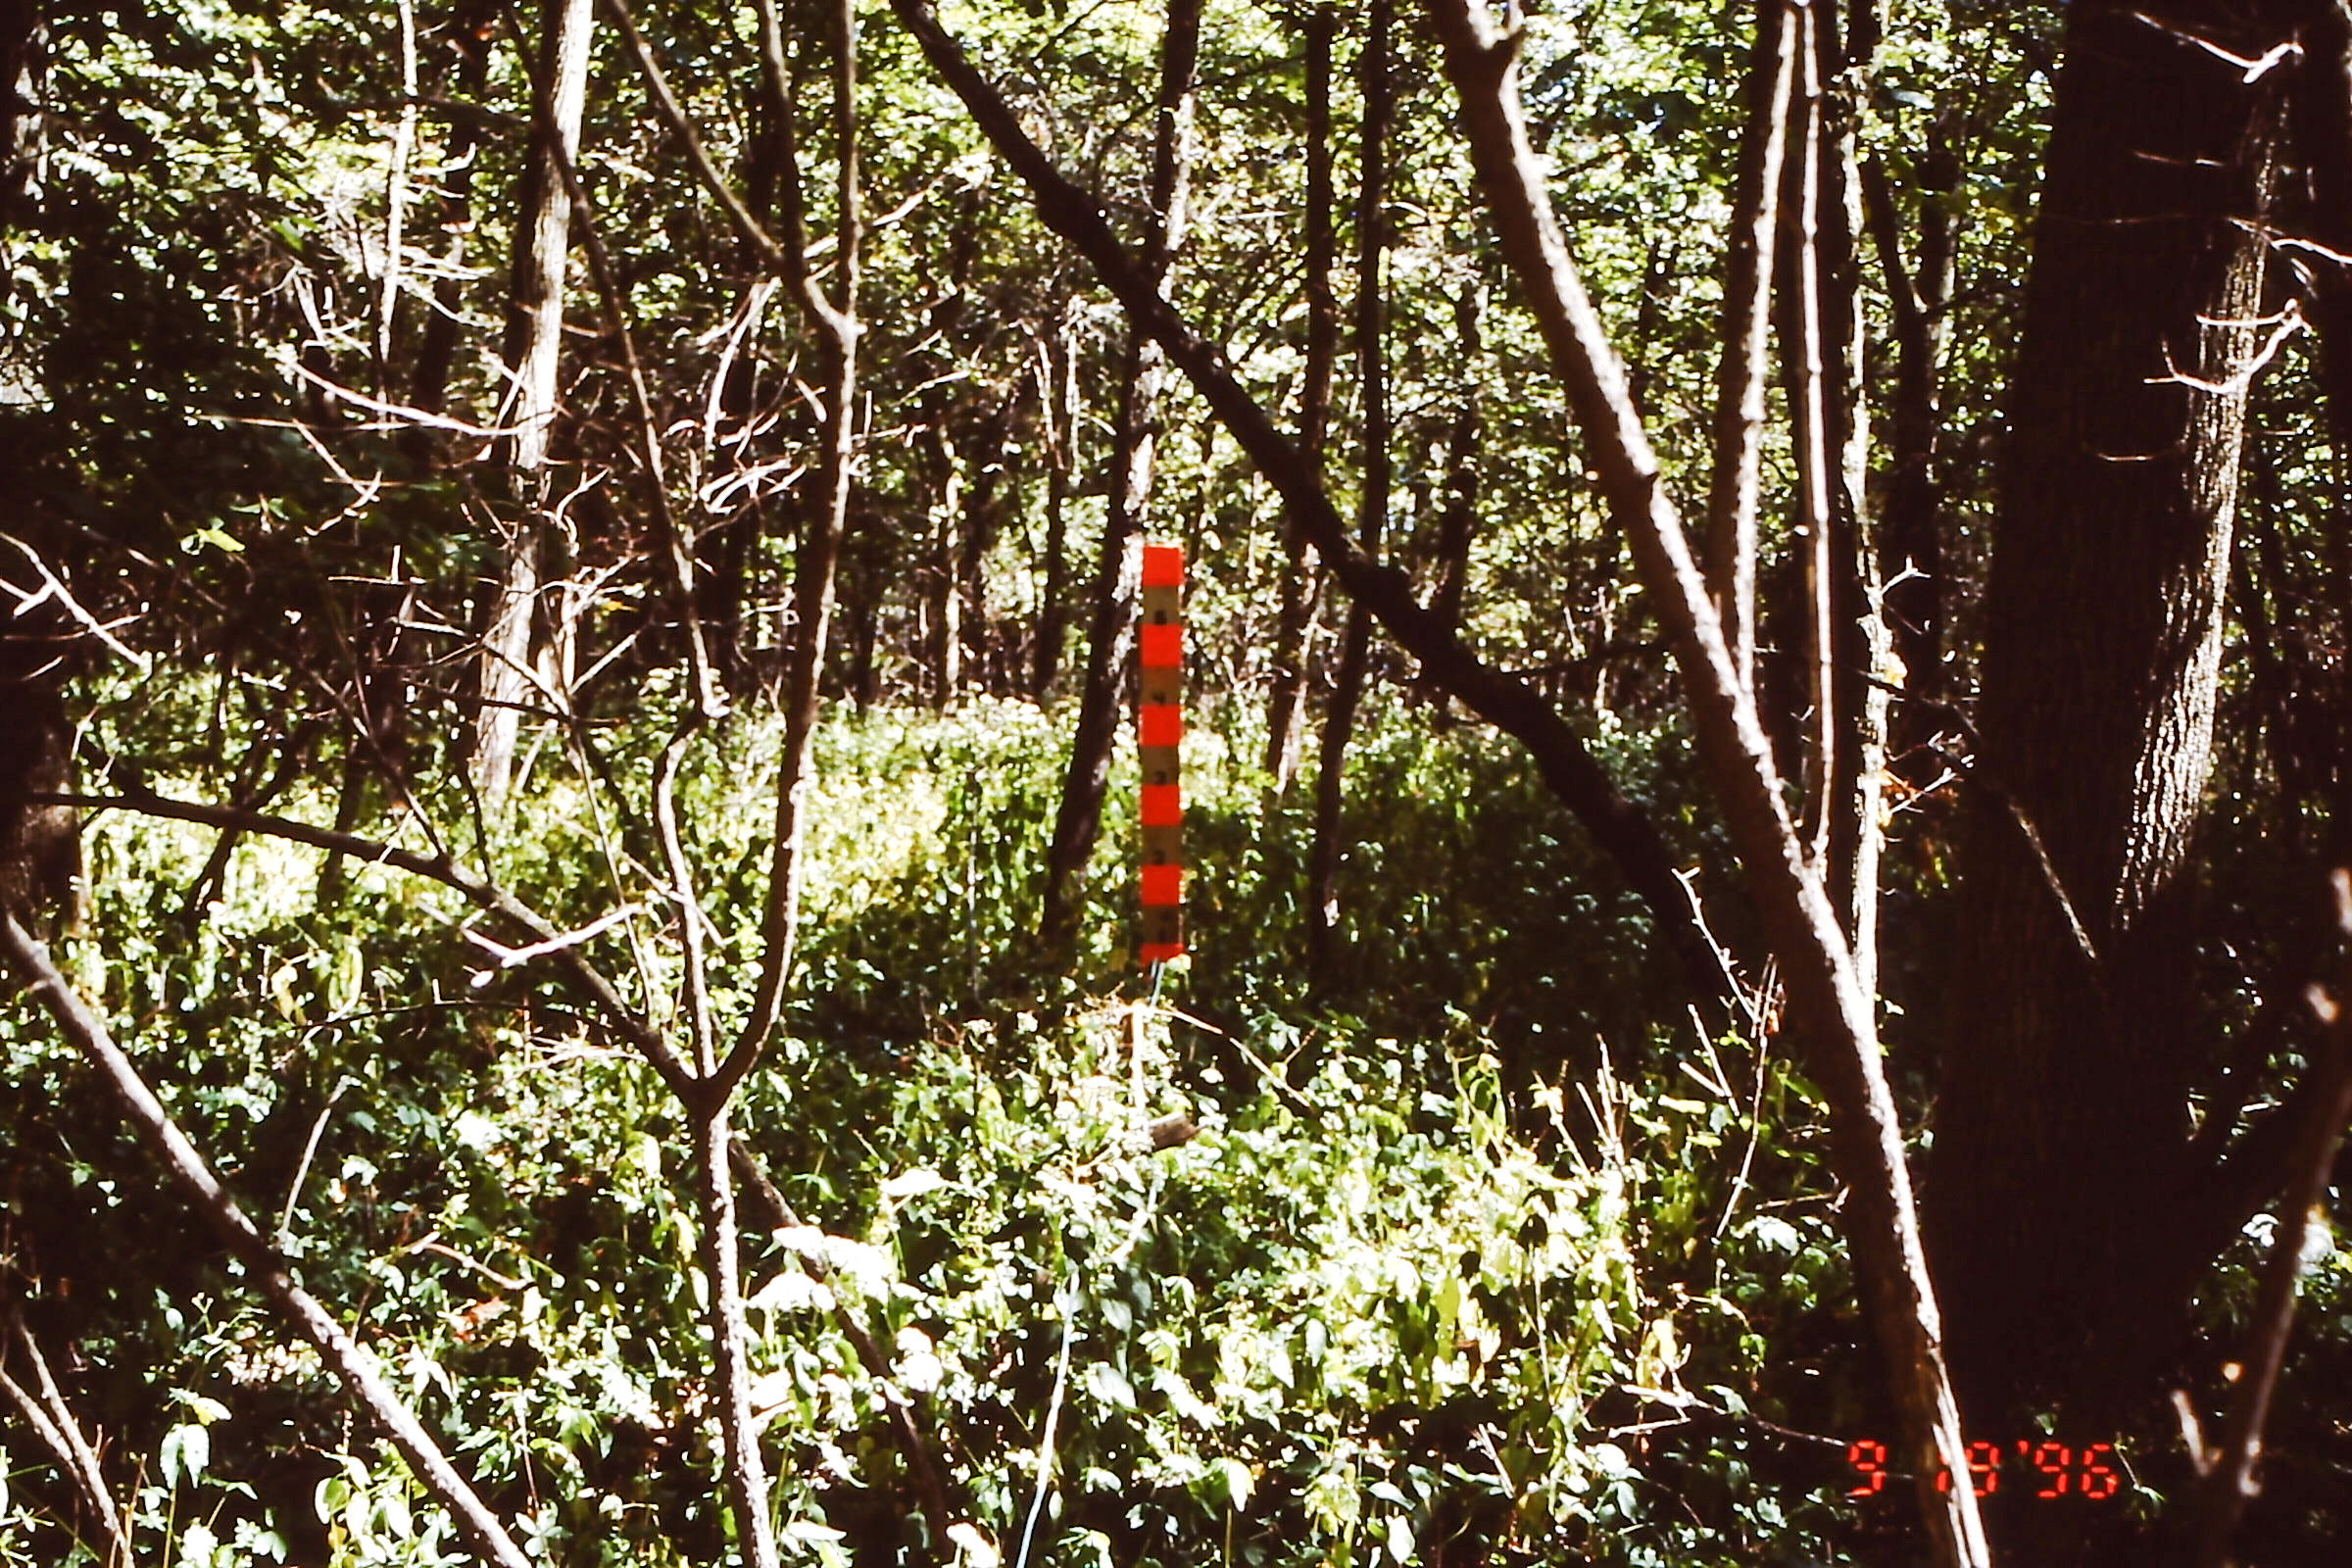
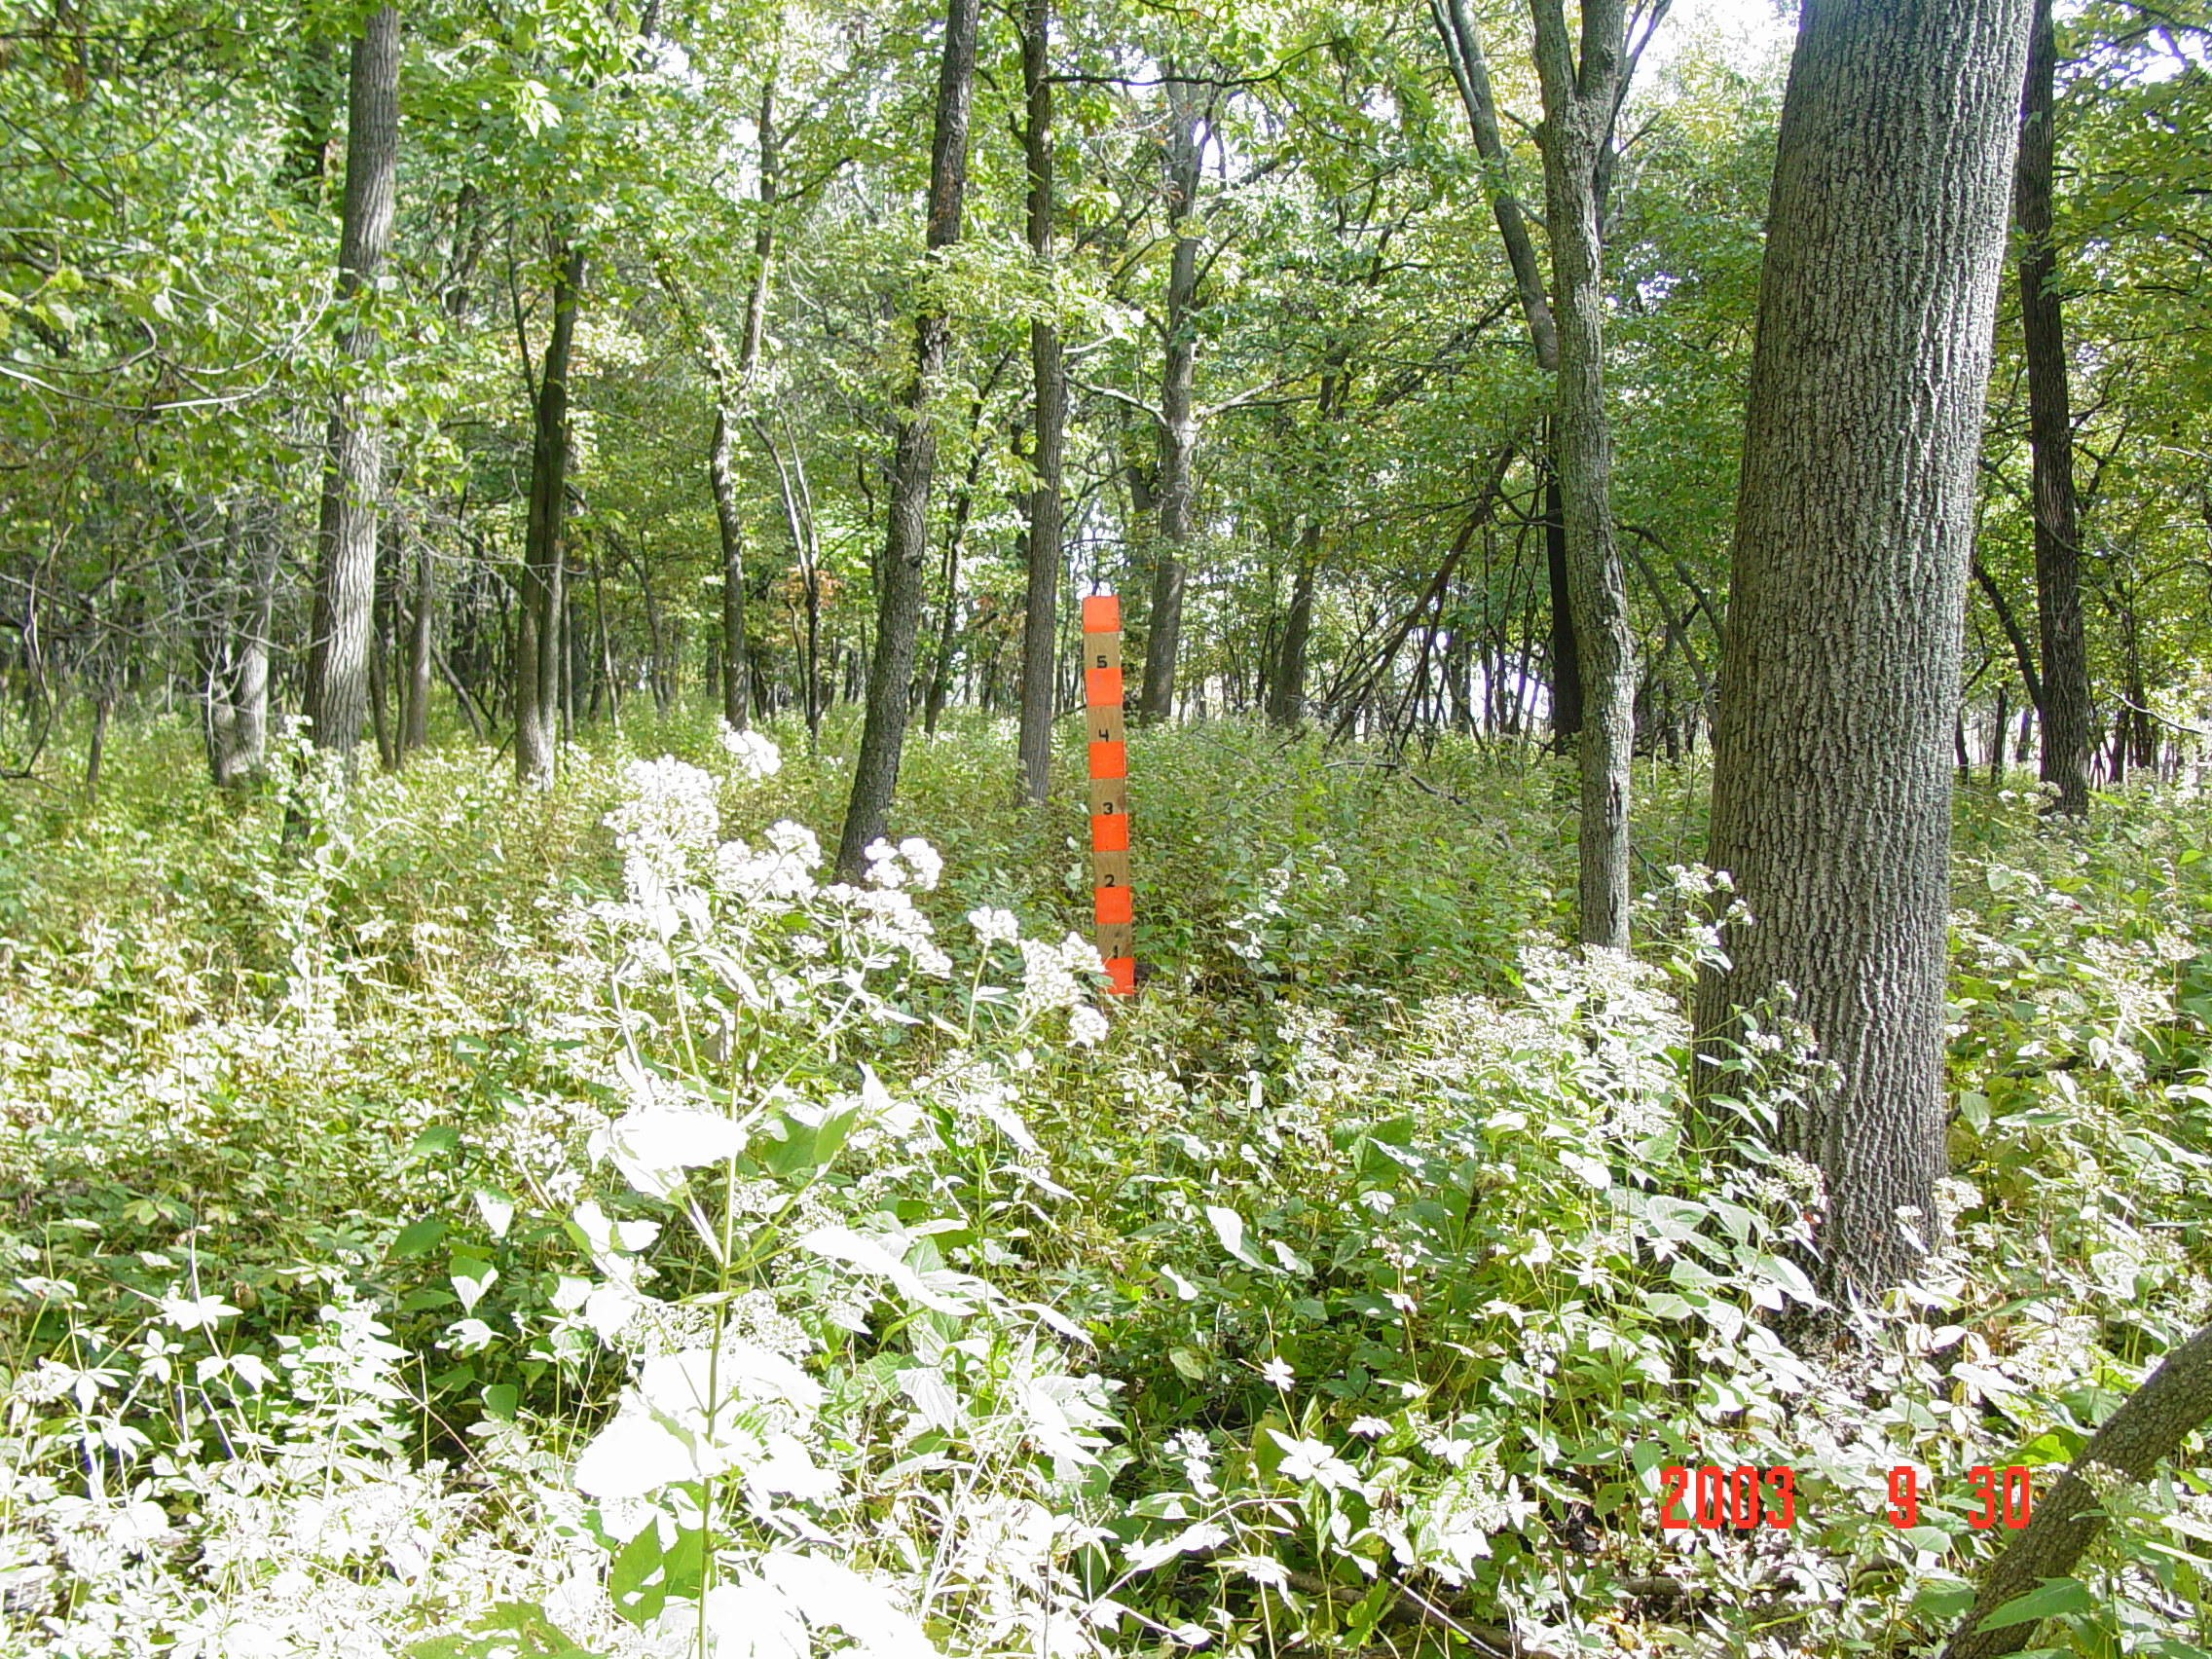
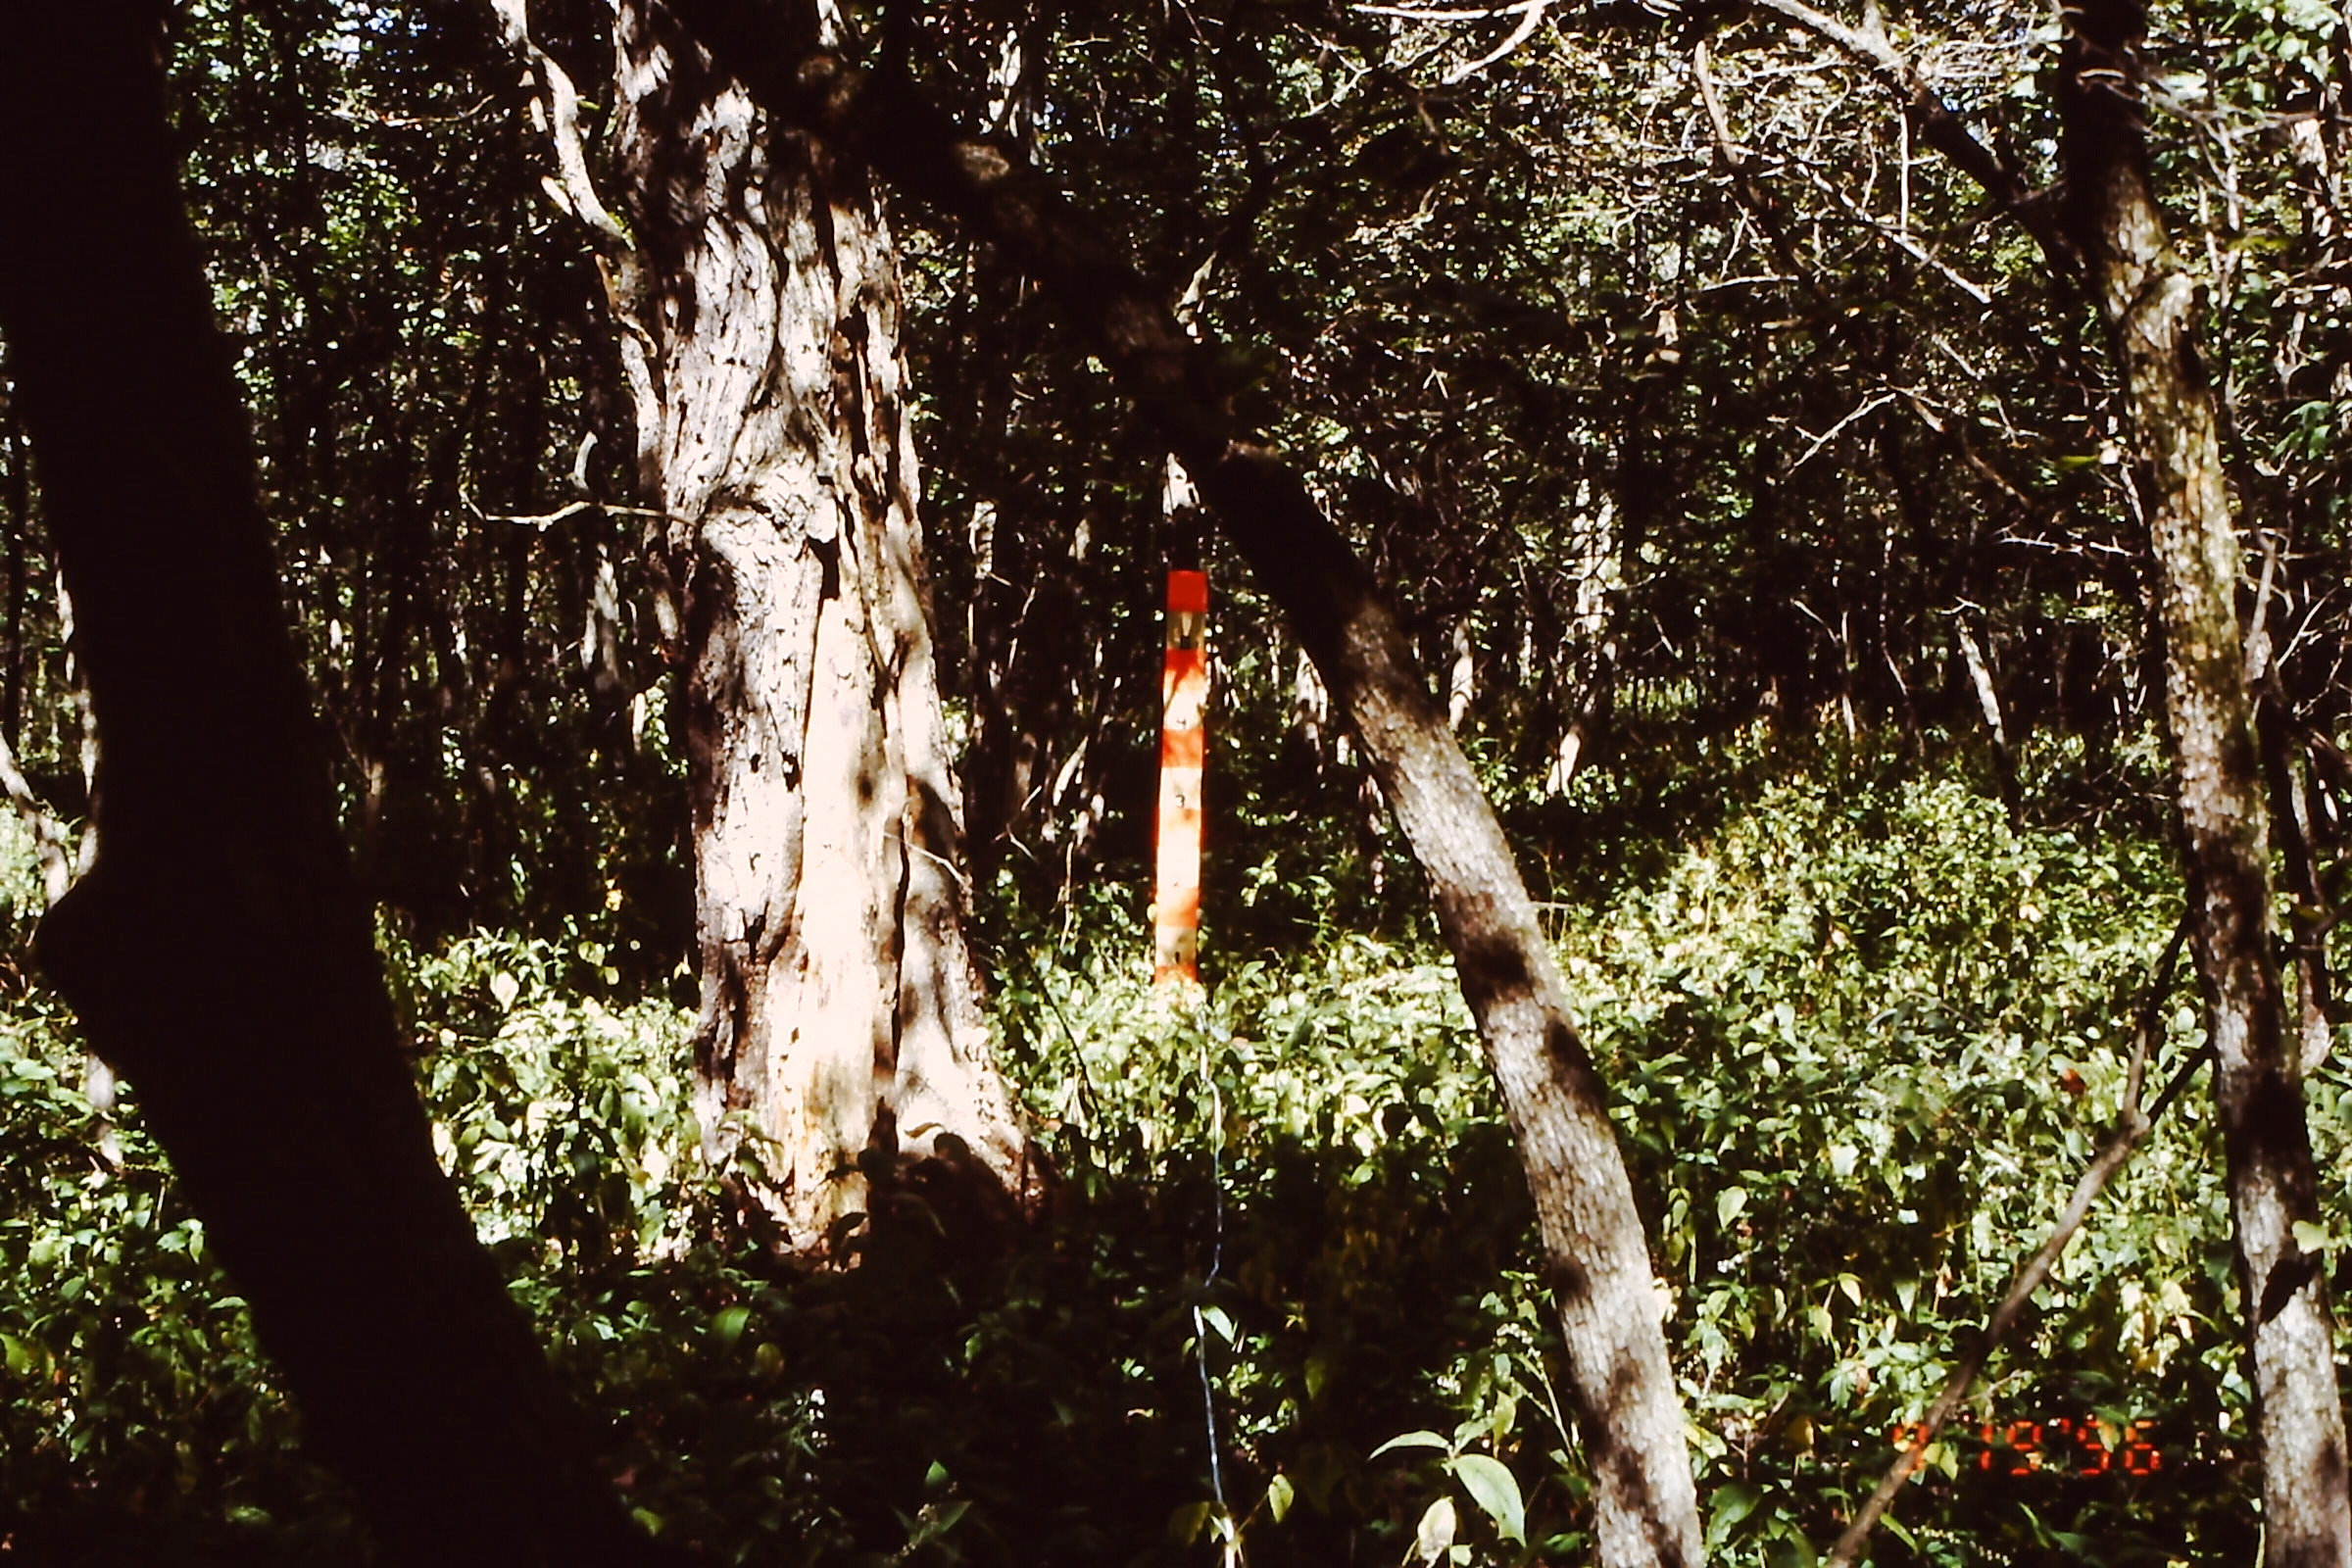
I wish we had started using a standardized protocol to assess fire severity decades ago. Here’s why: one of the most interesting and fun projects of my career was to do a 20-year repeat of a 1996 photo point monitoring study. It was a landscape-scale scavenger hunt combined with an ecologically interesting snapshot of two decades of change. When I analyzed the changes between 1996 and 2003, a dominant trend was that most of our woodlands had an increased density of understory trees. In general, the woodland floors had gotten darker and herbaceous vegetation had become sparser during that period. One exception to this trend was at Raccoon Grove Nature Preserve in Monee, IL. Unlike all the other woodlands, Raccoon Grove had less understory trees in 2003 than in 1996 and was visibly sunnier and brighter.
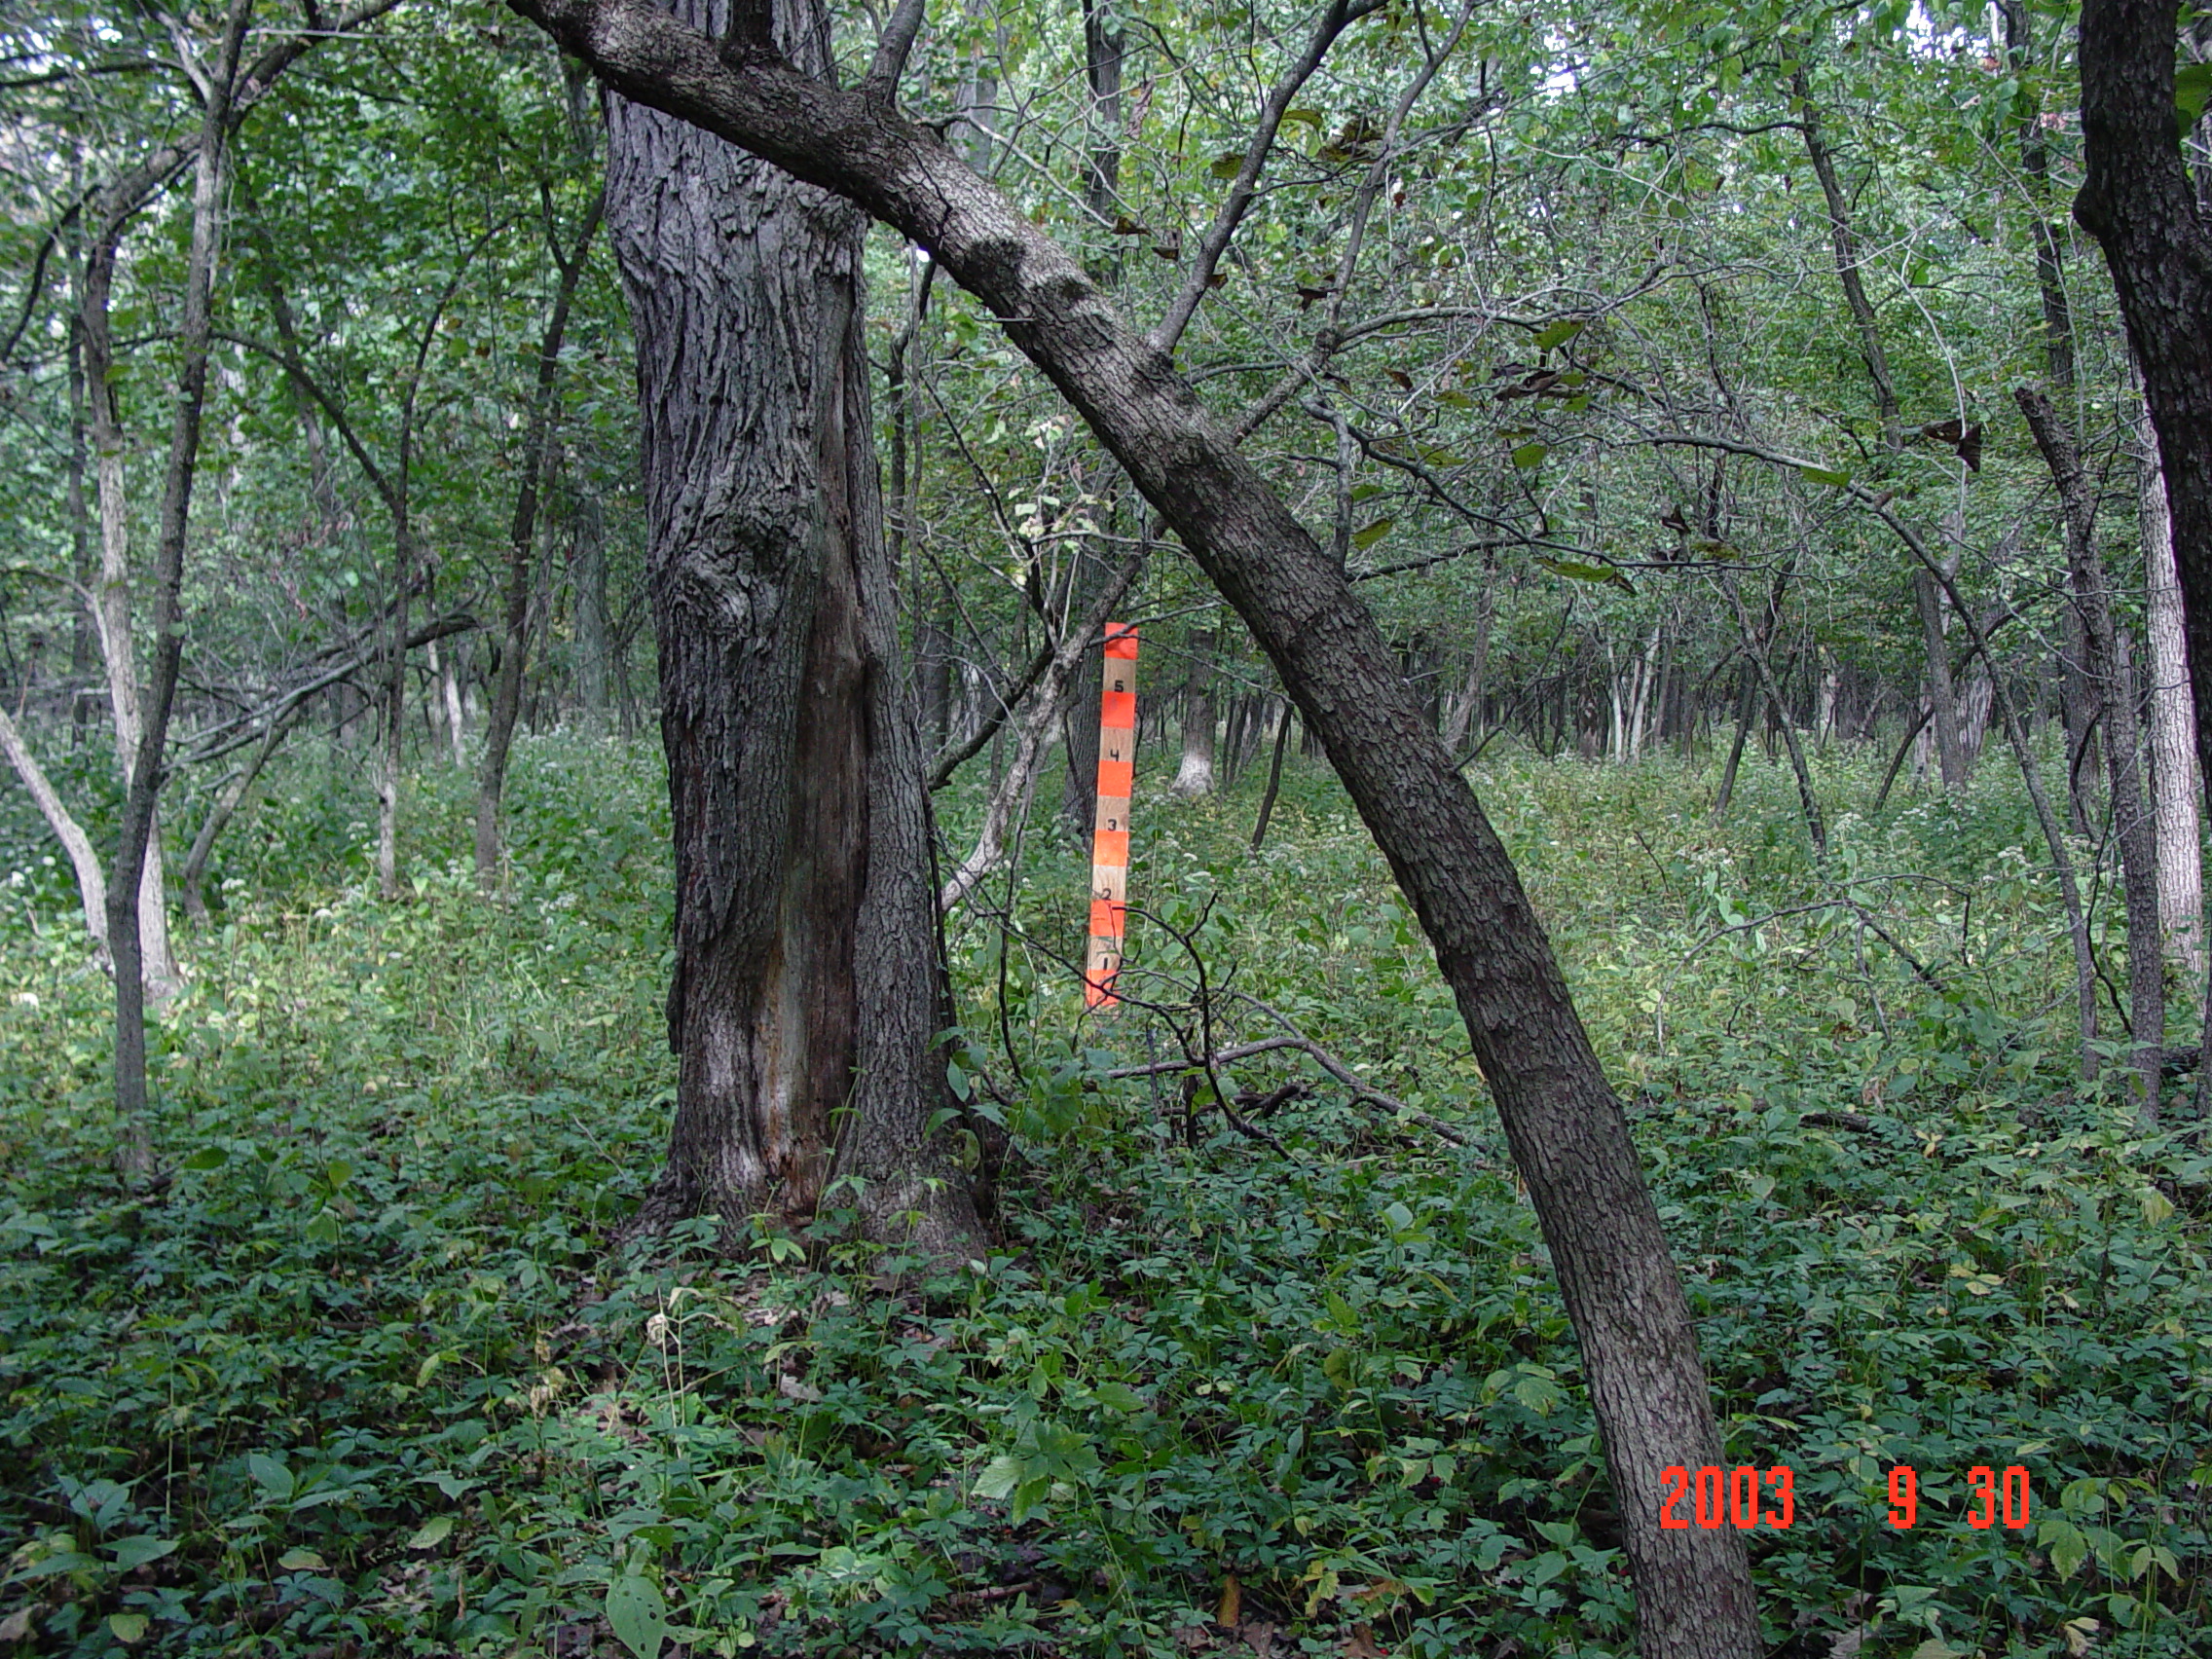
Raccoon Grove photo point in 1996 (left) and 2003 (right). The ground layer was visibly sunnier and brighter in 2003 and there were fewer understory trees.Another Raccoon Grove photo point in 1996 (left) and 2003 (right). Especially to the left and behind the marker, note the reduction in understory tree density.
This sunnier understory at Raccoon Grove was mystifying to me because the only ecological management that we had done during that period was routine prescribed burning. When I pulled the burn records for the period between 1996 and 2003, two of the burns at Raccoon Grove were done in the spring (3/28/01 and 4/3/03) under relatively “cool” conditions (rH 50%+, temps 35-50°F). One fall burn (11/24/98) was done under “moderate” conditions (rH 24‐50%, 50°F) in dry leaf litter. All three burns were reported to have 75-90% burn coverage, and they all seemed to be very normal prescribed burns. Based on the general descriptions given in the reports, none of the burns was the type of truly hot fire that I would expect to kill trees and thin the understory density.
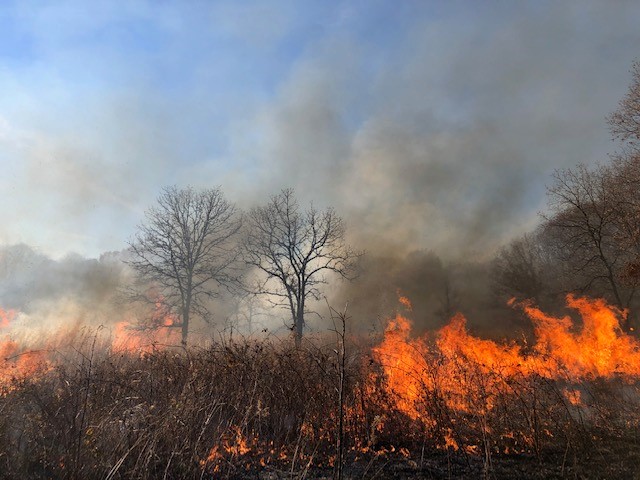
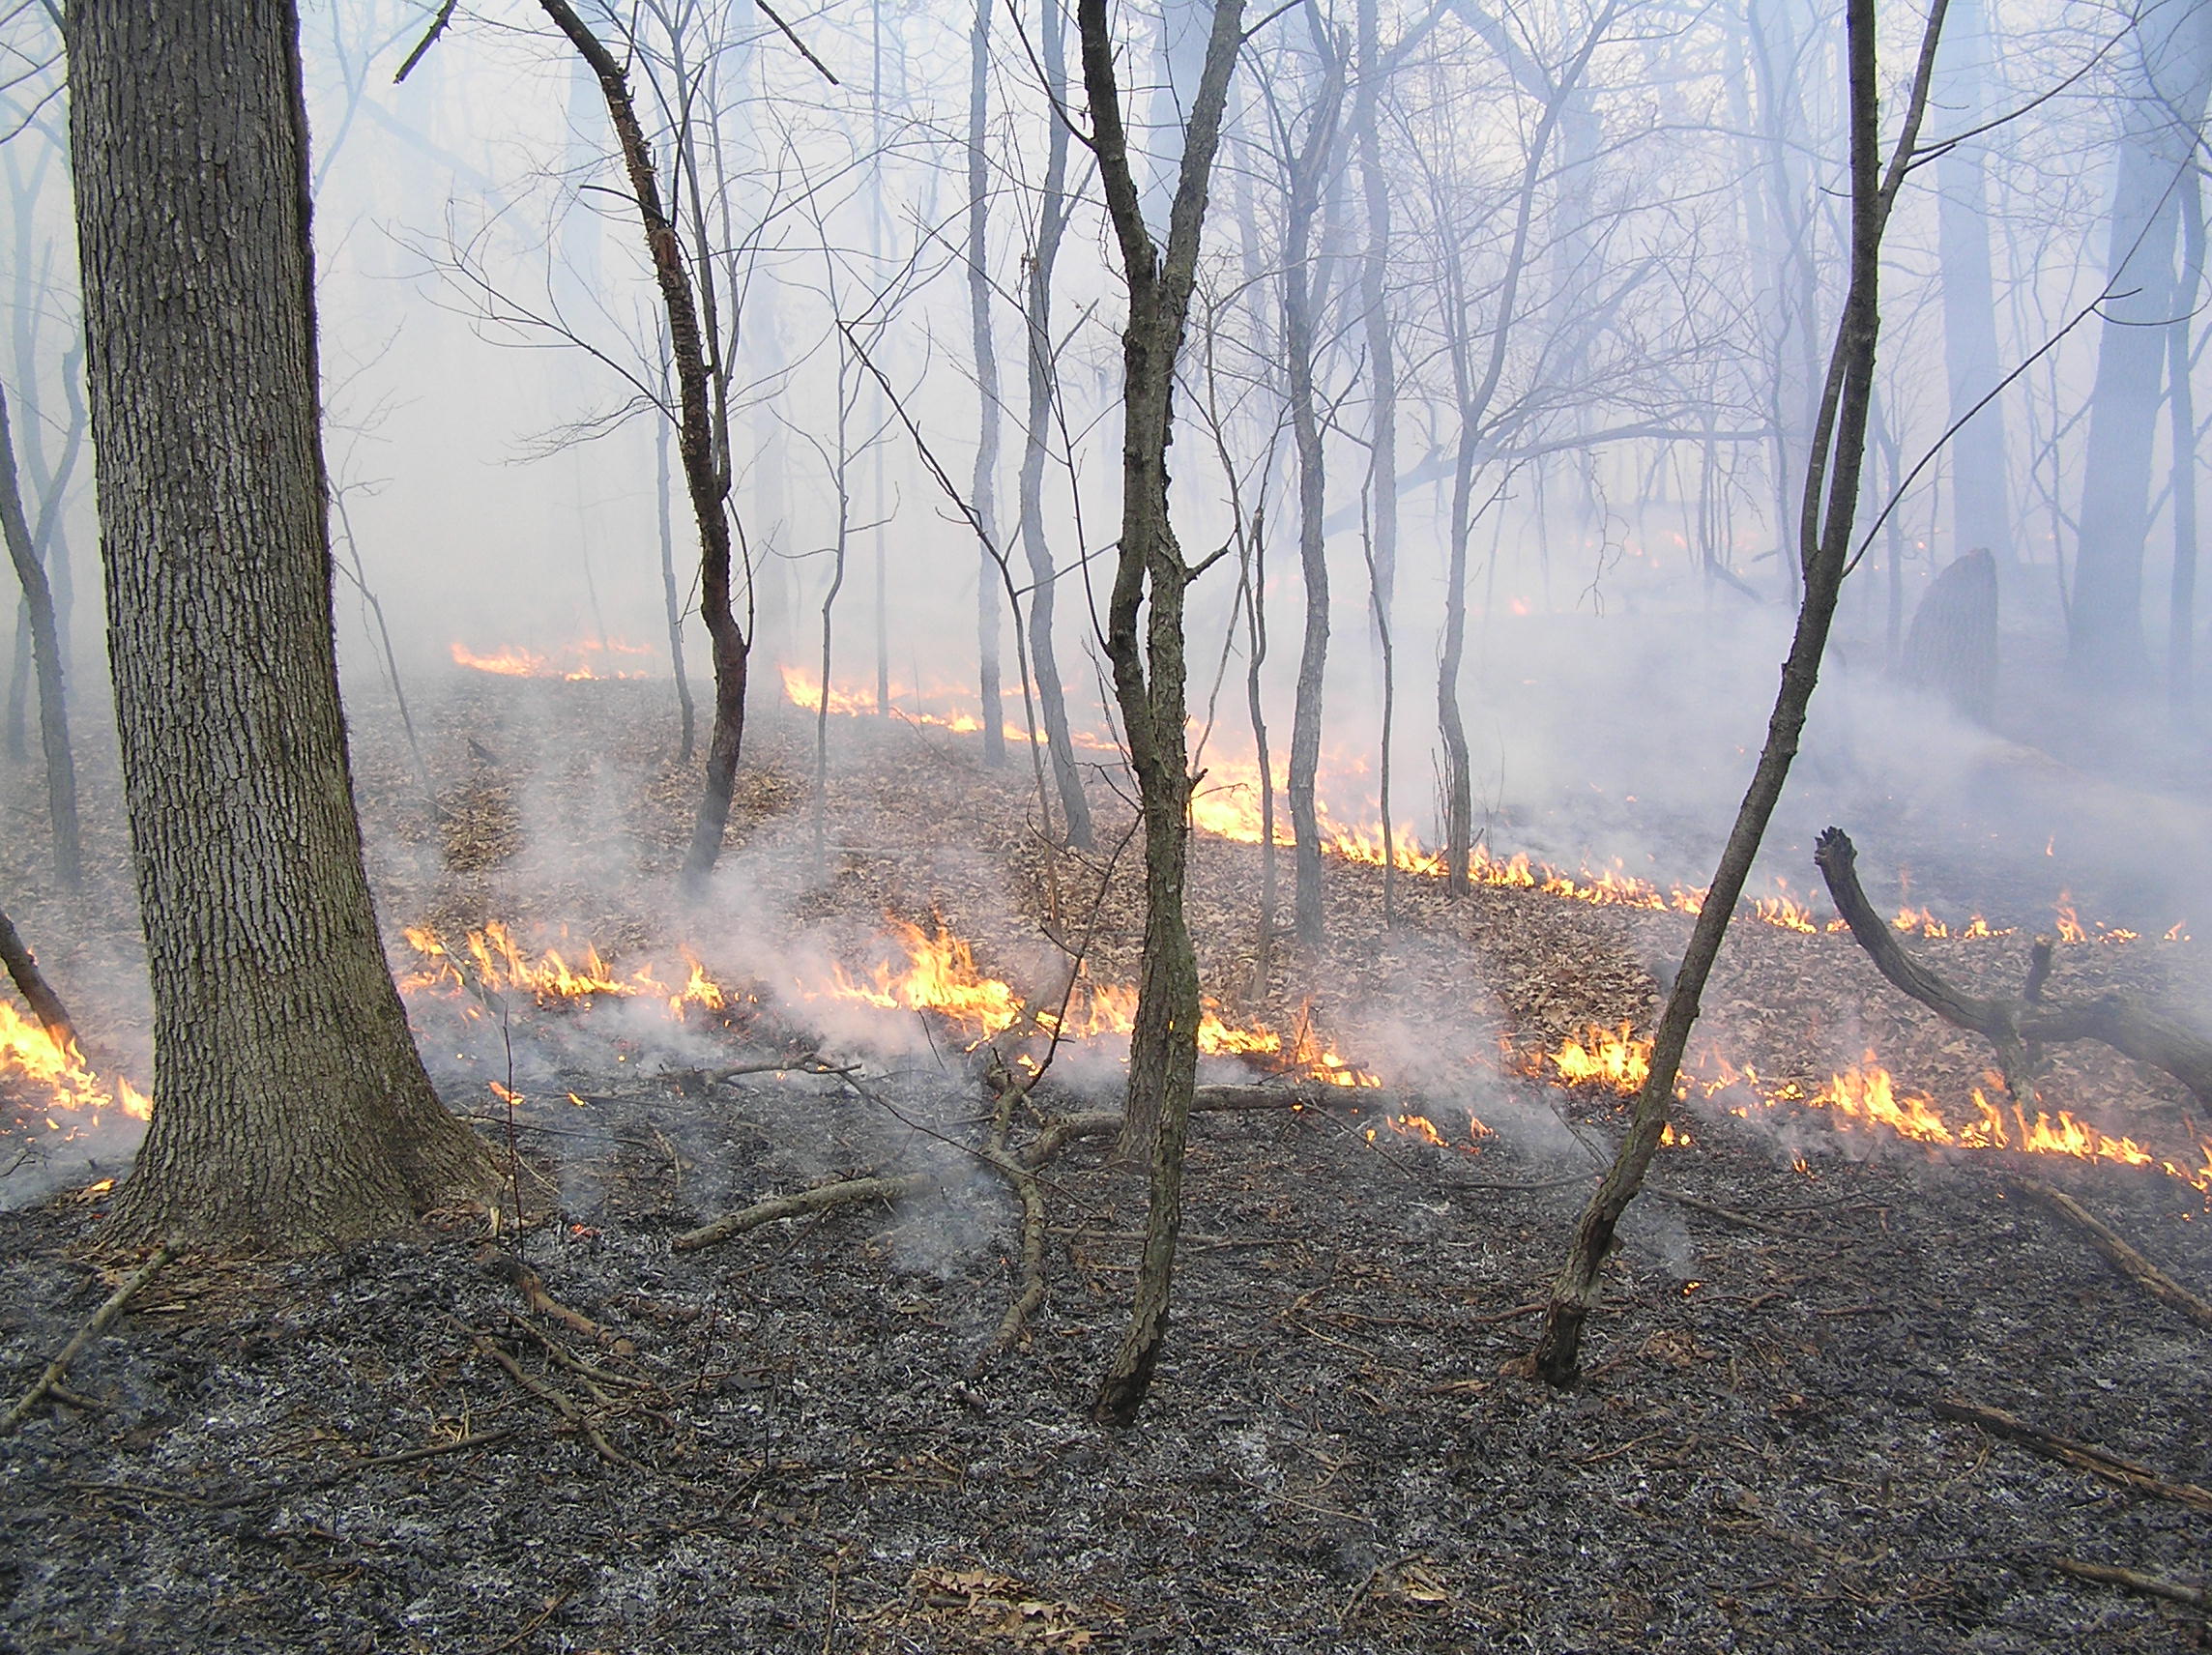
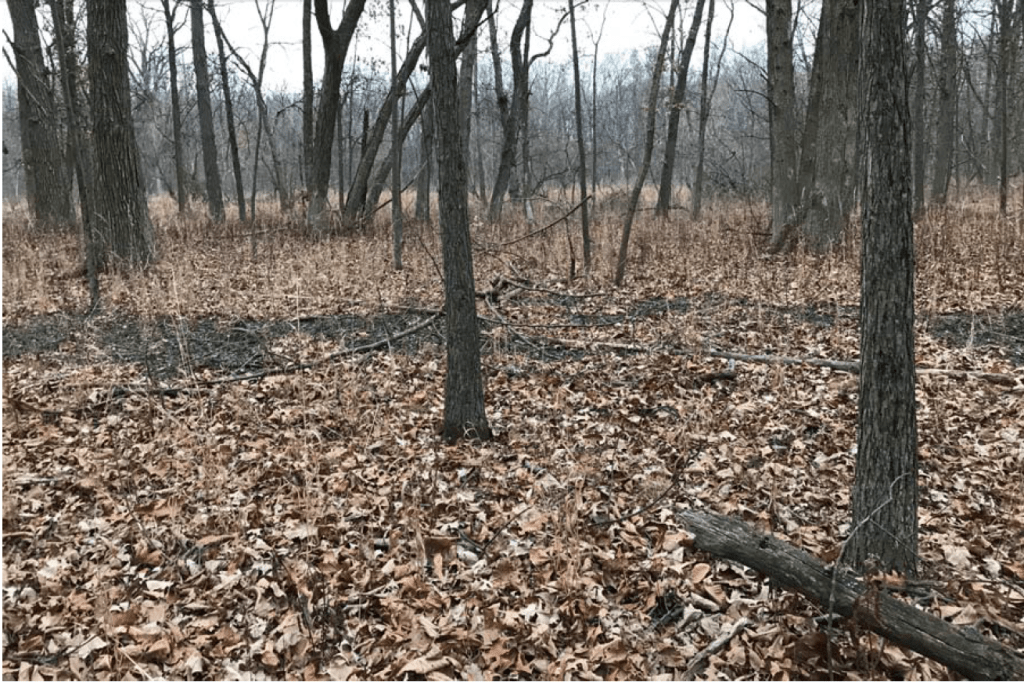
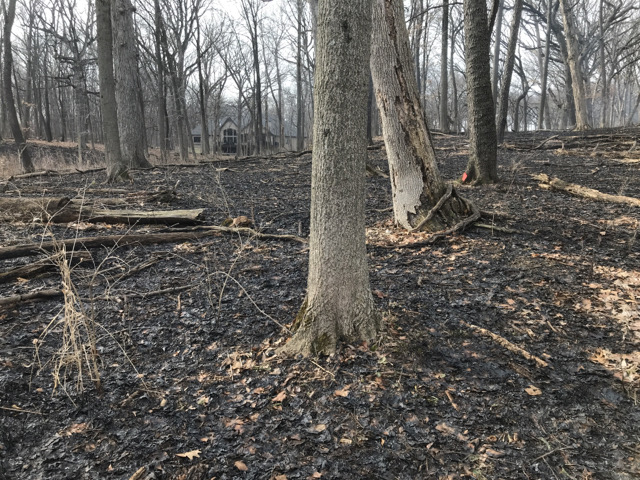
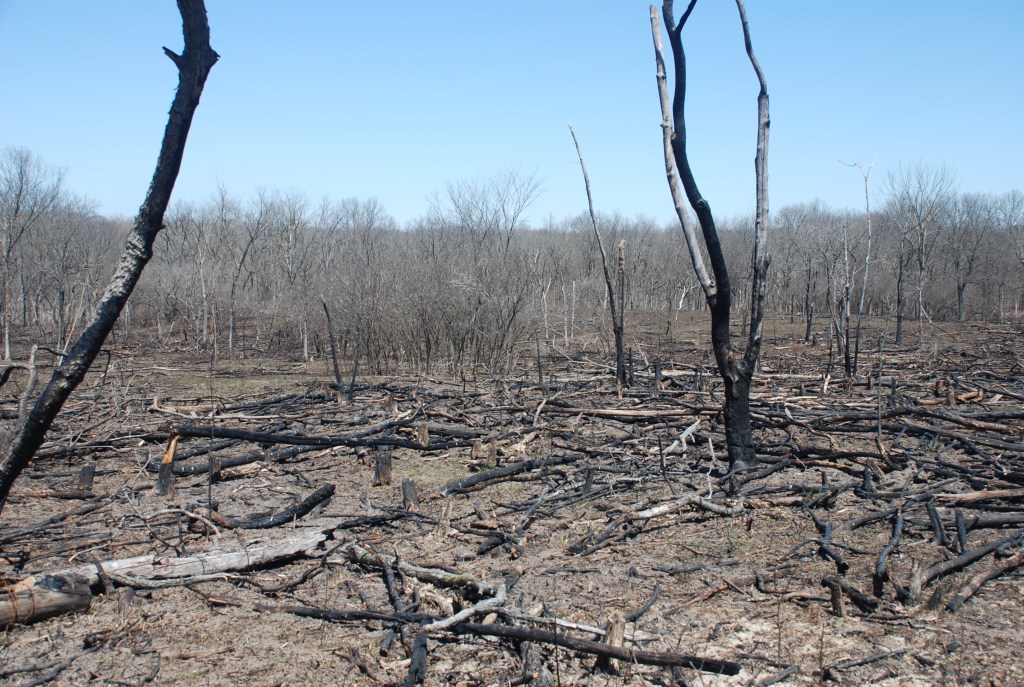
Typical prescribed burn at Raccoon Grove, with an assessed fire intensity of patchily lightly burned (category 3.5).
An earlier burn’s report had some crumbs that indicate a potentially hotter fire: this burn was done in the spring (4/2/1996), and conditions were described as “hot” in the prairie and along the forest edge but “cool” in the interior forest. Although weather conditions were not unusual for prescribed burns (rH 35-40%, temps 50-70°F), the burn report references smoldering logs and indicates that fire reignited overnight and had to be put out on a neighbor’s property the next day.
I wish we had used a better protocol to characterize the severity of prescribed burns back then. I would love to know if a more complete and intense burn in the substrate layer from just one burn potentially was responsible for the understory tree thinning that resulted. Or, perhaps, the burn frequency of four “solid” burns in seven years was a bigger factor. With better monitoring, we would be able to tease out the different aspects contributing to a fire’s effects. We would know better how to prescribe burn conditions to meet specific management outcomes.
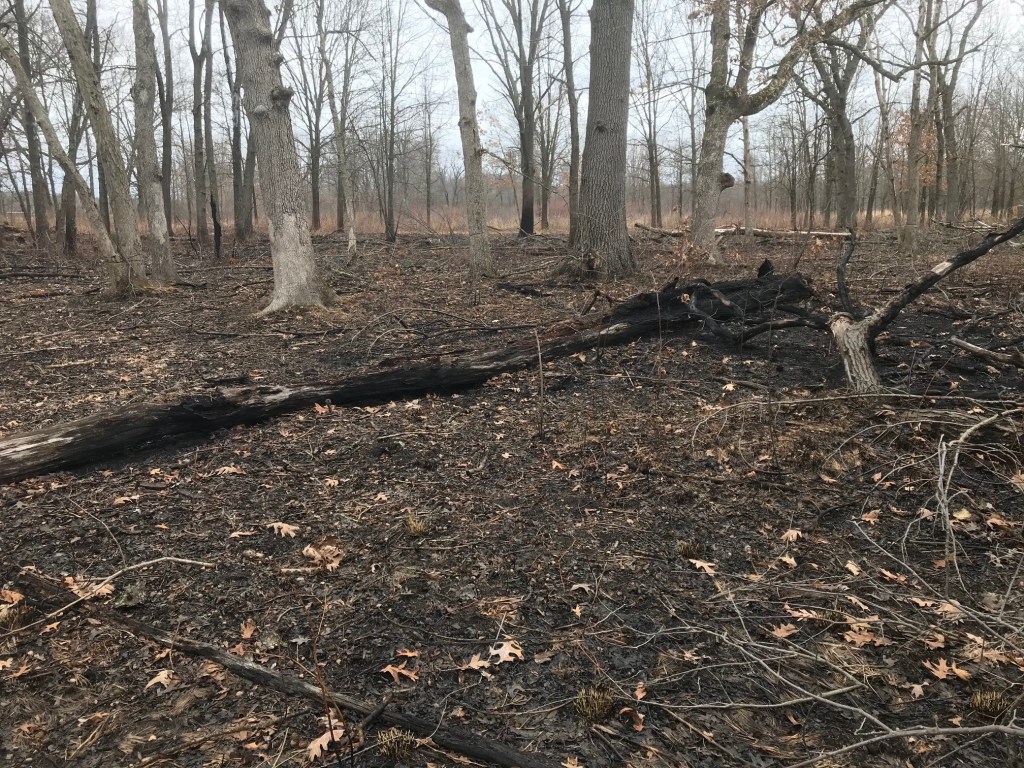
Post-burn monitoring to document and characterize a fire’s intensity.
Prescribed burning is one of the ecological management activities that has higher risks to human and wildlife safety. That makes it important to make sure that the prescribed burns are meeting management objectives. It doesn’t take much extra time to do prescribed burn monitoring, and to accumulate data to learn better how fire intensity can influence vegetation communities. No need to wait – start using a standardized protocol to monitor your fire’s effects during this burn season. Our future selves and future ecologists will thank us!
Julianne Mason, Ecological Management Supervisor, Forest Preserve District of Will County, Illinois
I know, I know. There’s a lot to do during prescribed burn season and monitoring typically isn’t high on the list of pressing priorities. However, I would like to make the case that prescribed burn monitoring doesn’t have to take up much additional time, and the data is well worth the small amount of additional effort!
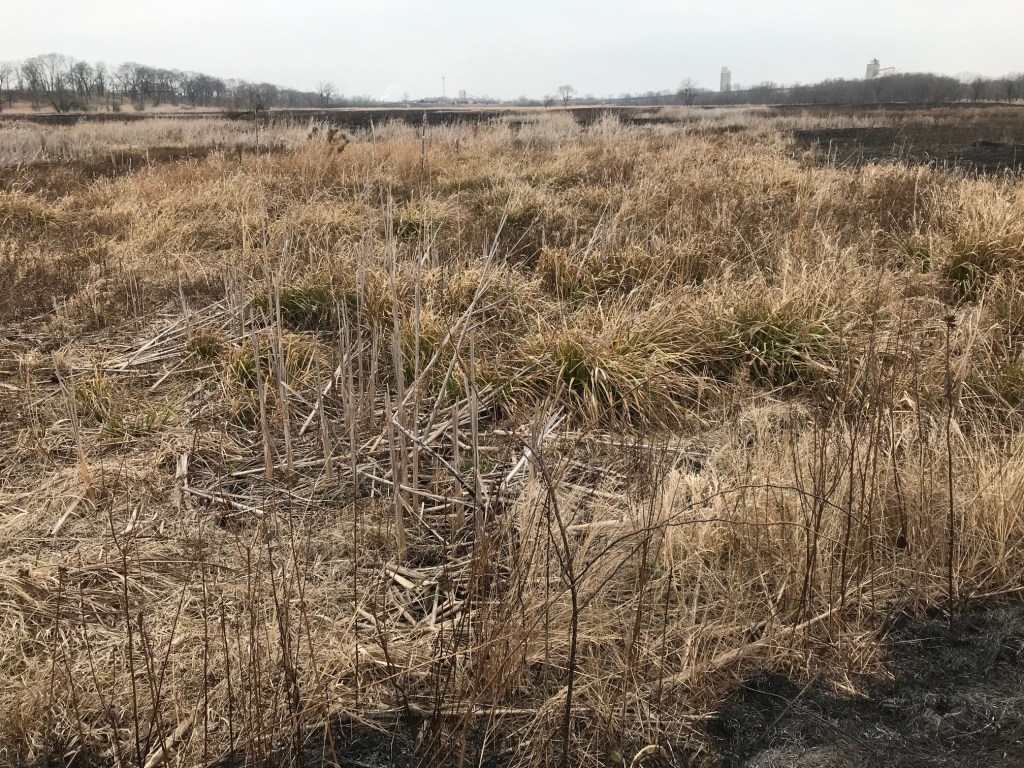
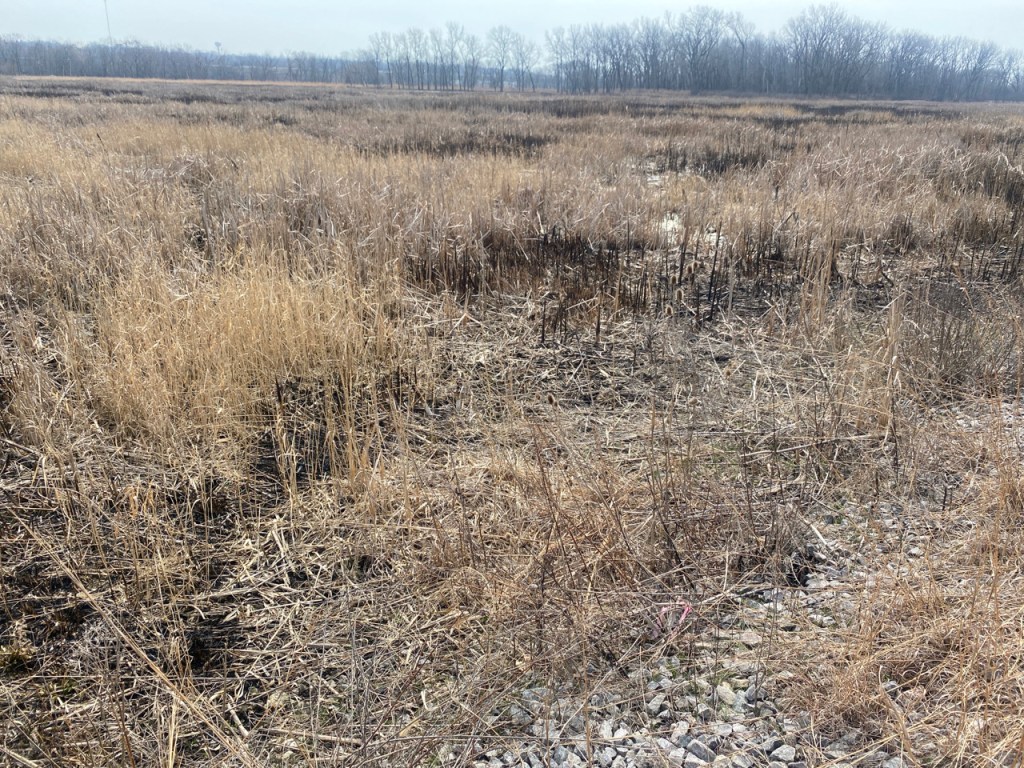
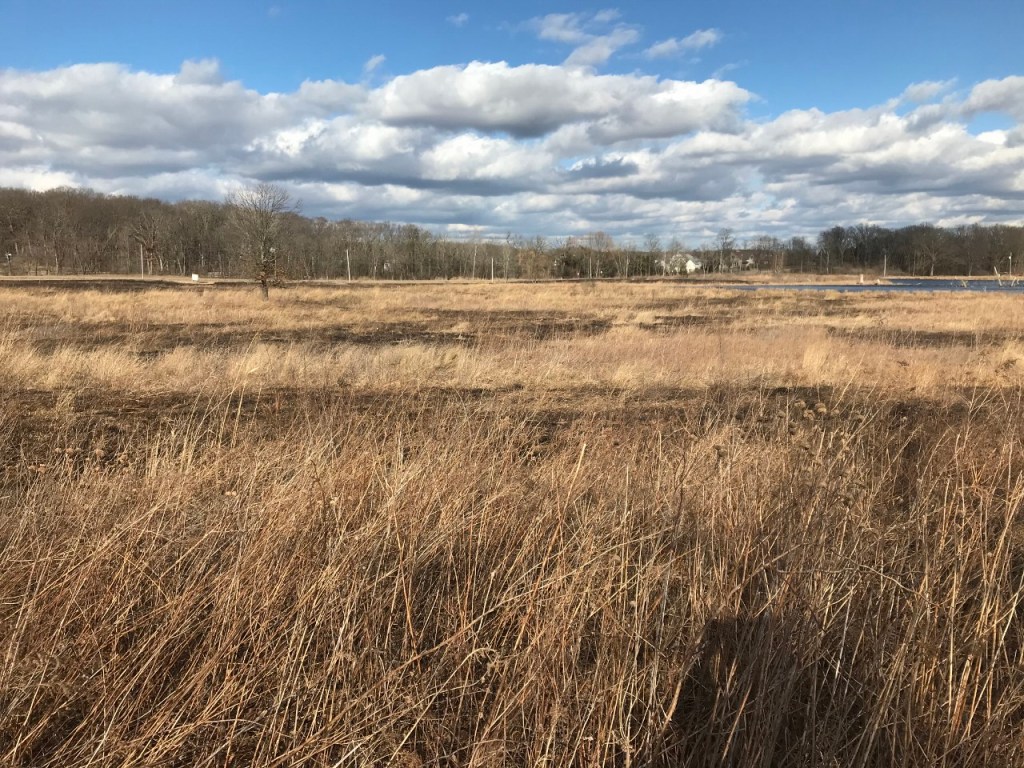
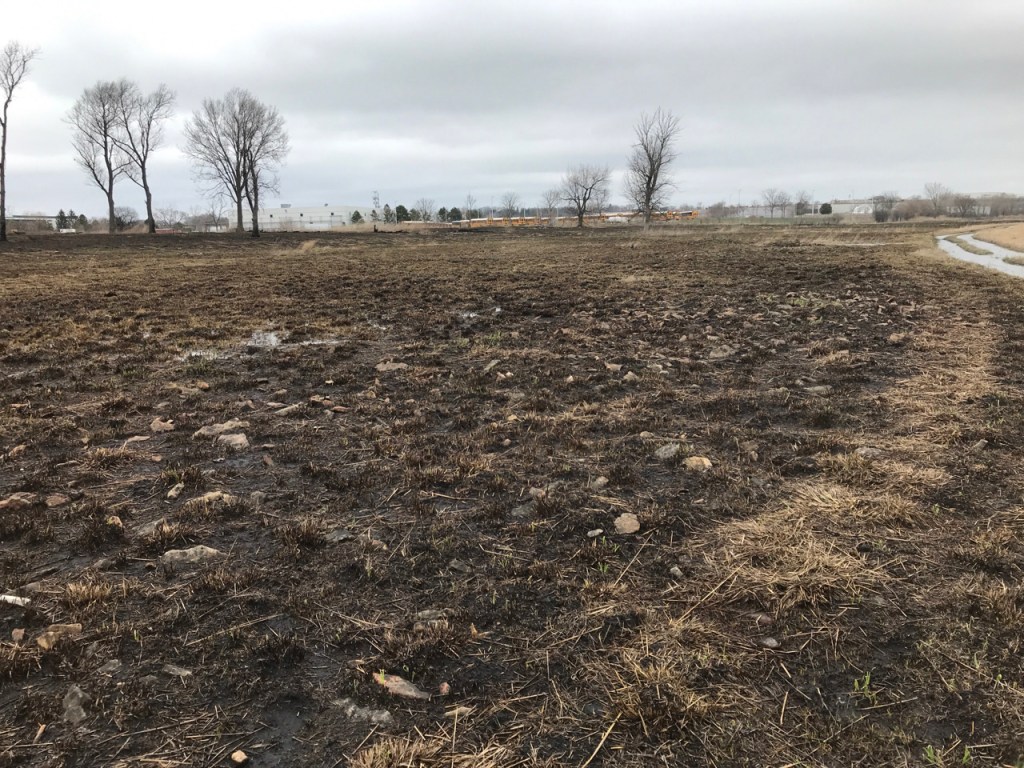
The ecological effects of prescribed burns can vary a lot depending on seasonality, frequency, and fire intensity. Seasonality and frequency are pretty straightforward to track over time by just recording the dates and areas burned. Fire intensity is more complicated to infer since it is affected by many factors like weather conditions (relative humidity, temperature, wind speed), fuel moisture levels, fuel model type (grassland vs woodland), and firing techniques (backing, flanking, or headfires).
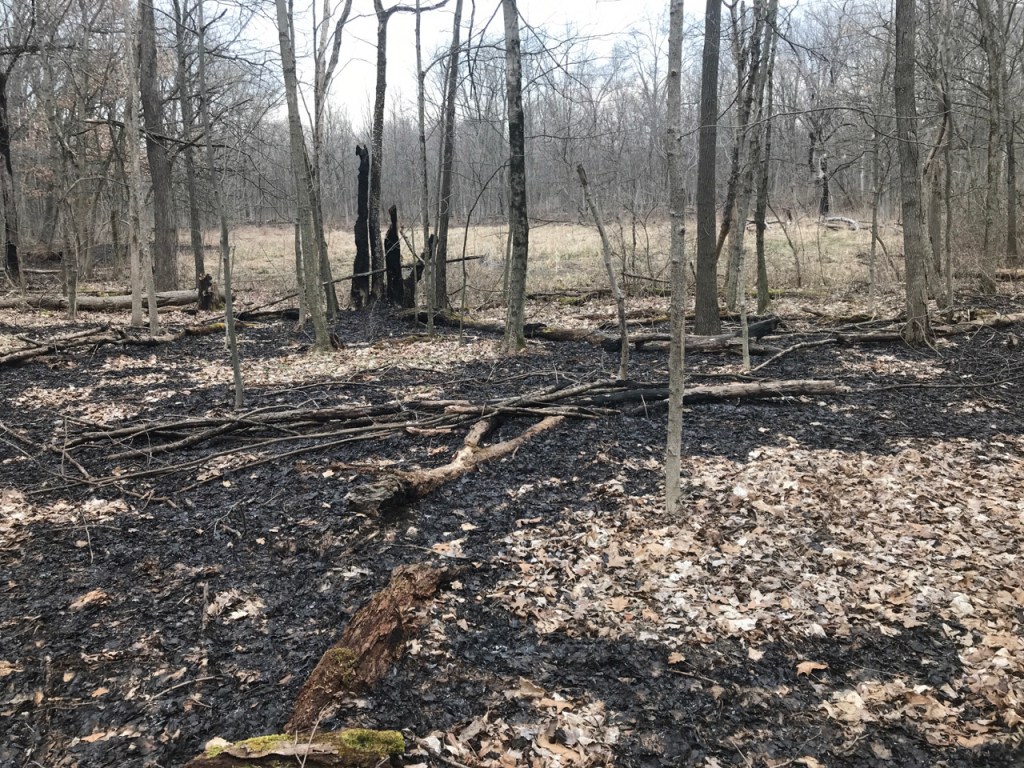
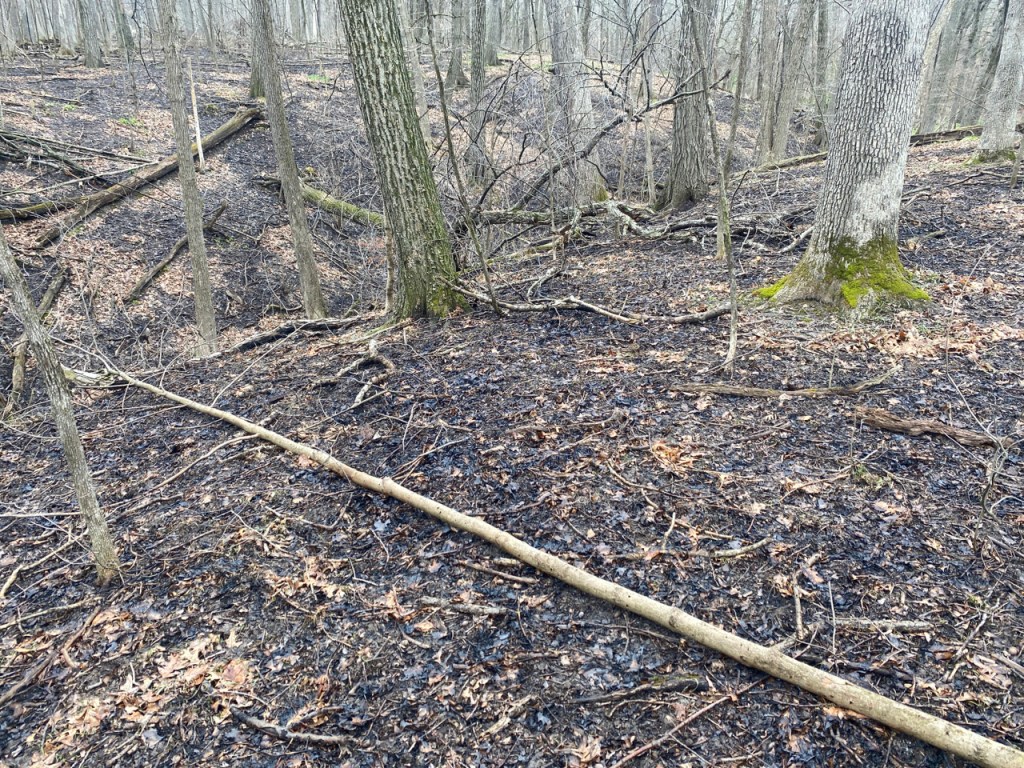
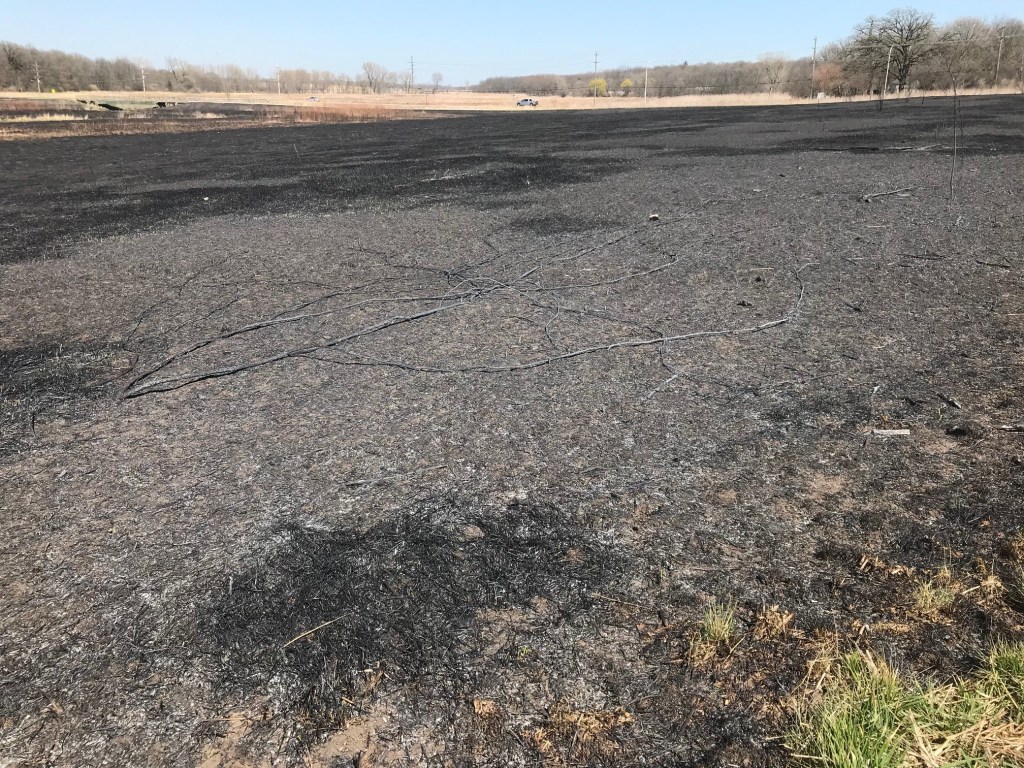
Some burns are hot.Some burns are not.
Fire monitoring after a “hot” burn. The organic litter was fully consumed, vegetation was fully consumed, and char heights were 6’ high.
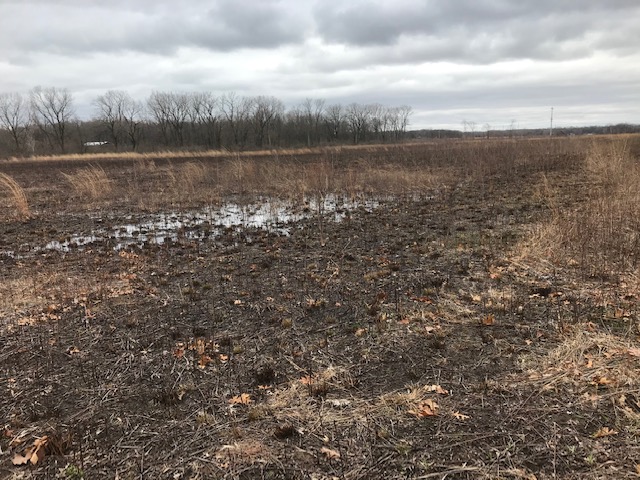
Fire monitoring after a “cool” burn. The burn coverage was incomplete, the lower layers of leaves were totally unburned even in burned areas, and char heights were <1/4’ high.
We have a network of photo monitoring points that we use to track plant community changes through time. Basically, we have GPS points and just go back to the same locations every few years to take photos facing in a standardized direction. Simple, right?
Permanent photo point locations are a simple way to track vegetation community changes through time. We have been coupling that data set of photos with fire severity monitoring data.
For the past eight years or so, we have been using a greatly simplified version of the National Park Service’s Fire Monitoring Handbook protocol to assess burn severity. If you don’t want to read their whole protocol, just jump to page 110. Our version of burn severity monitoring is as follows.
Take post-burn photos at each permanent photo point monitoring location in the burned unit.
At each monitoring location, walk 5 meters in the direction that the photo was taken. Within a 3 m radius, record the percent burn coverage.
Assess the burn severity category for the substrate layer (duff/leaf litter) and vegetation layers using the categories below (this is our modification of the NPS categories).
The maximum char height is averaged for the nearest three woodies and recorded.
We use the ESRI Field Maps app to take the photos and enter the data into a geodatabase. Easy-peasy!
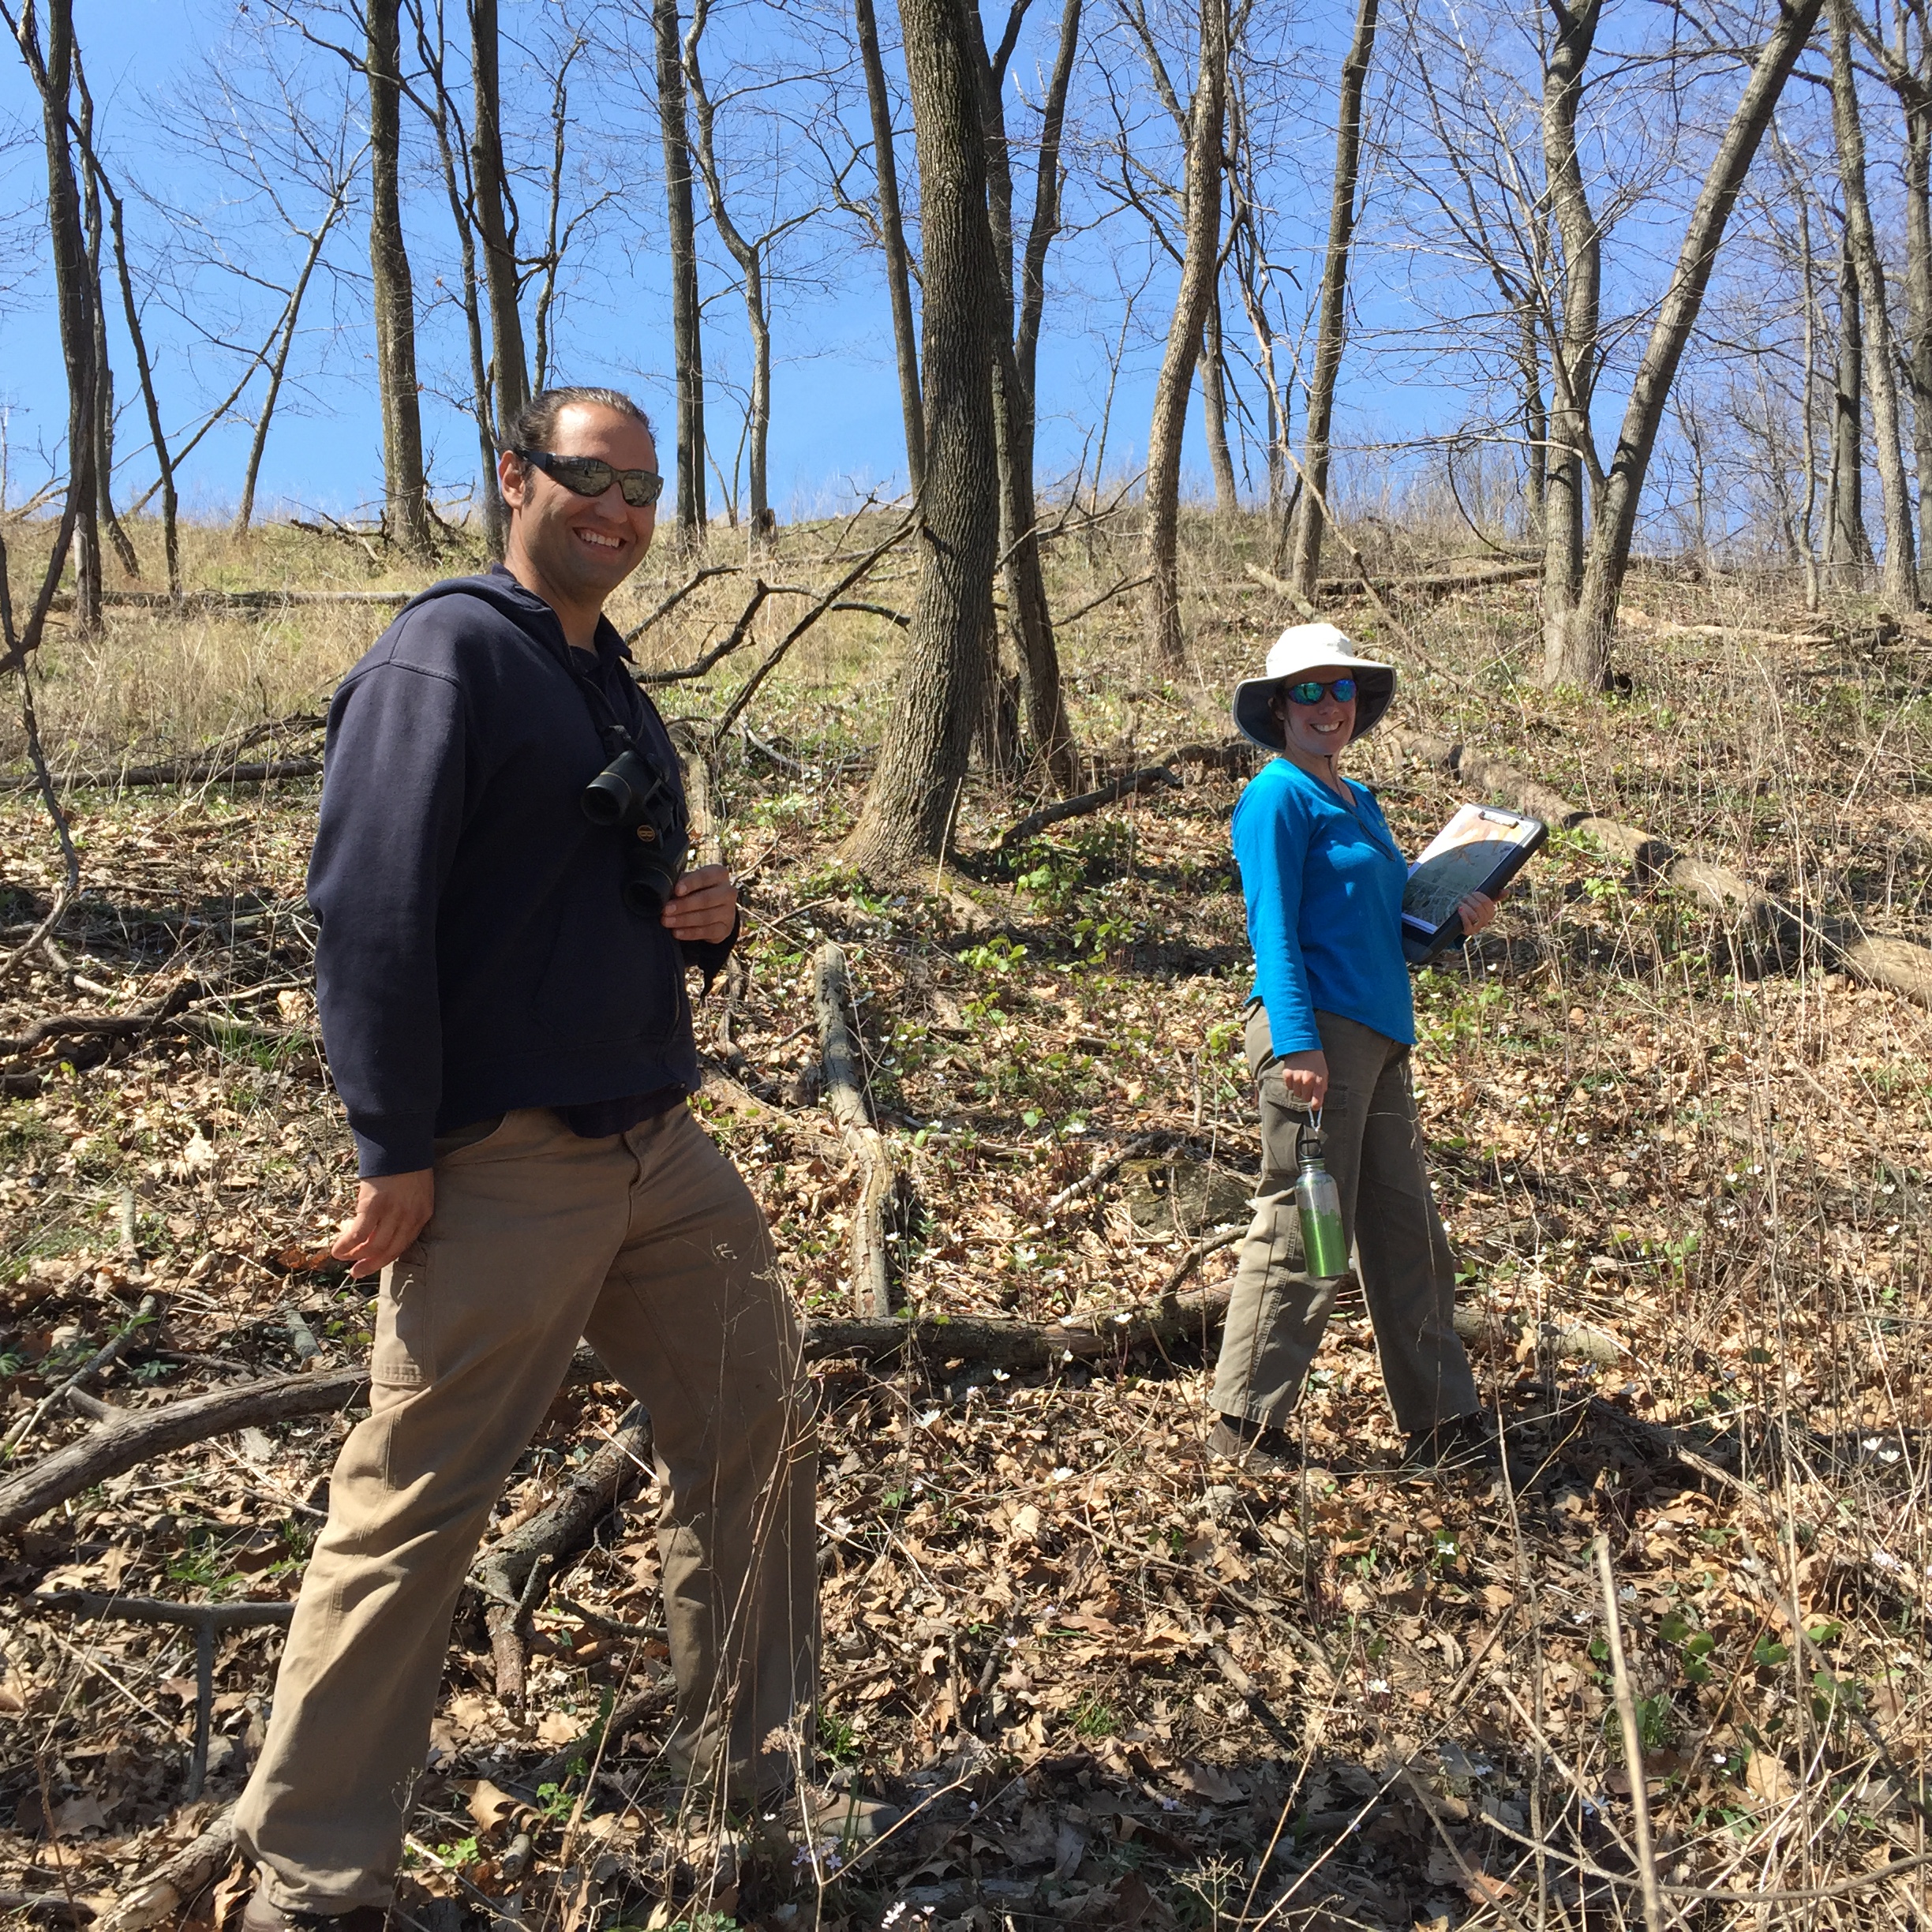
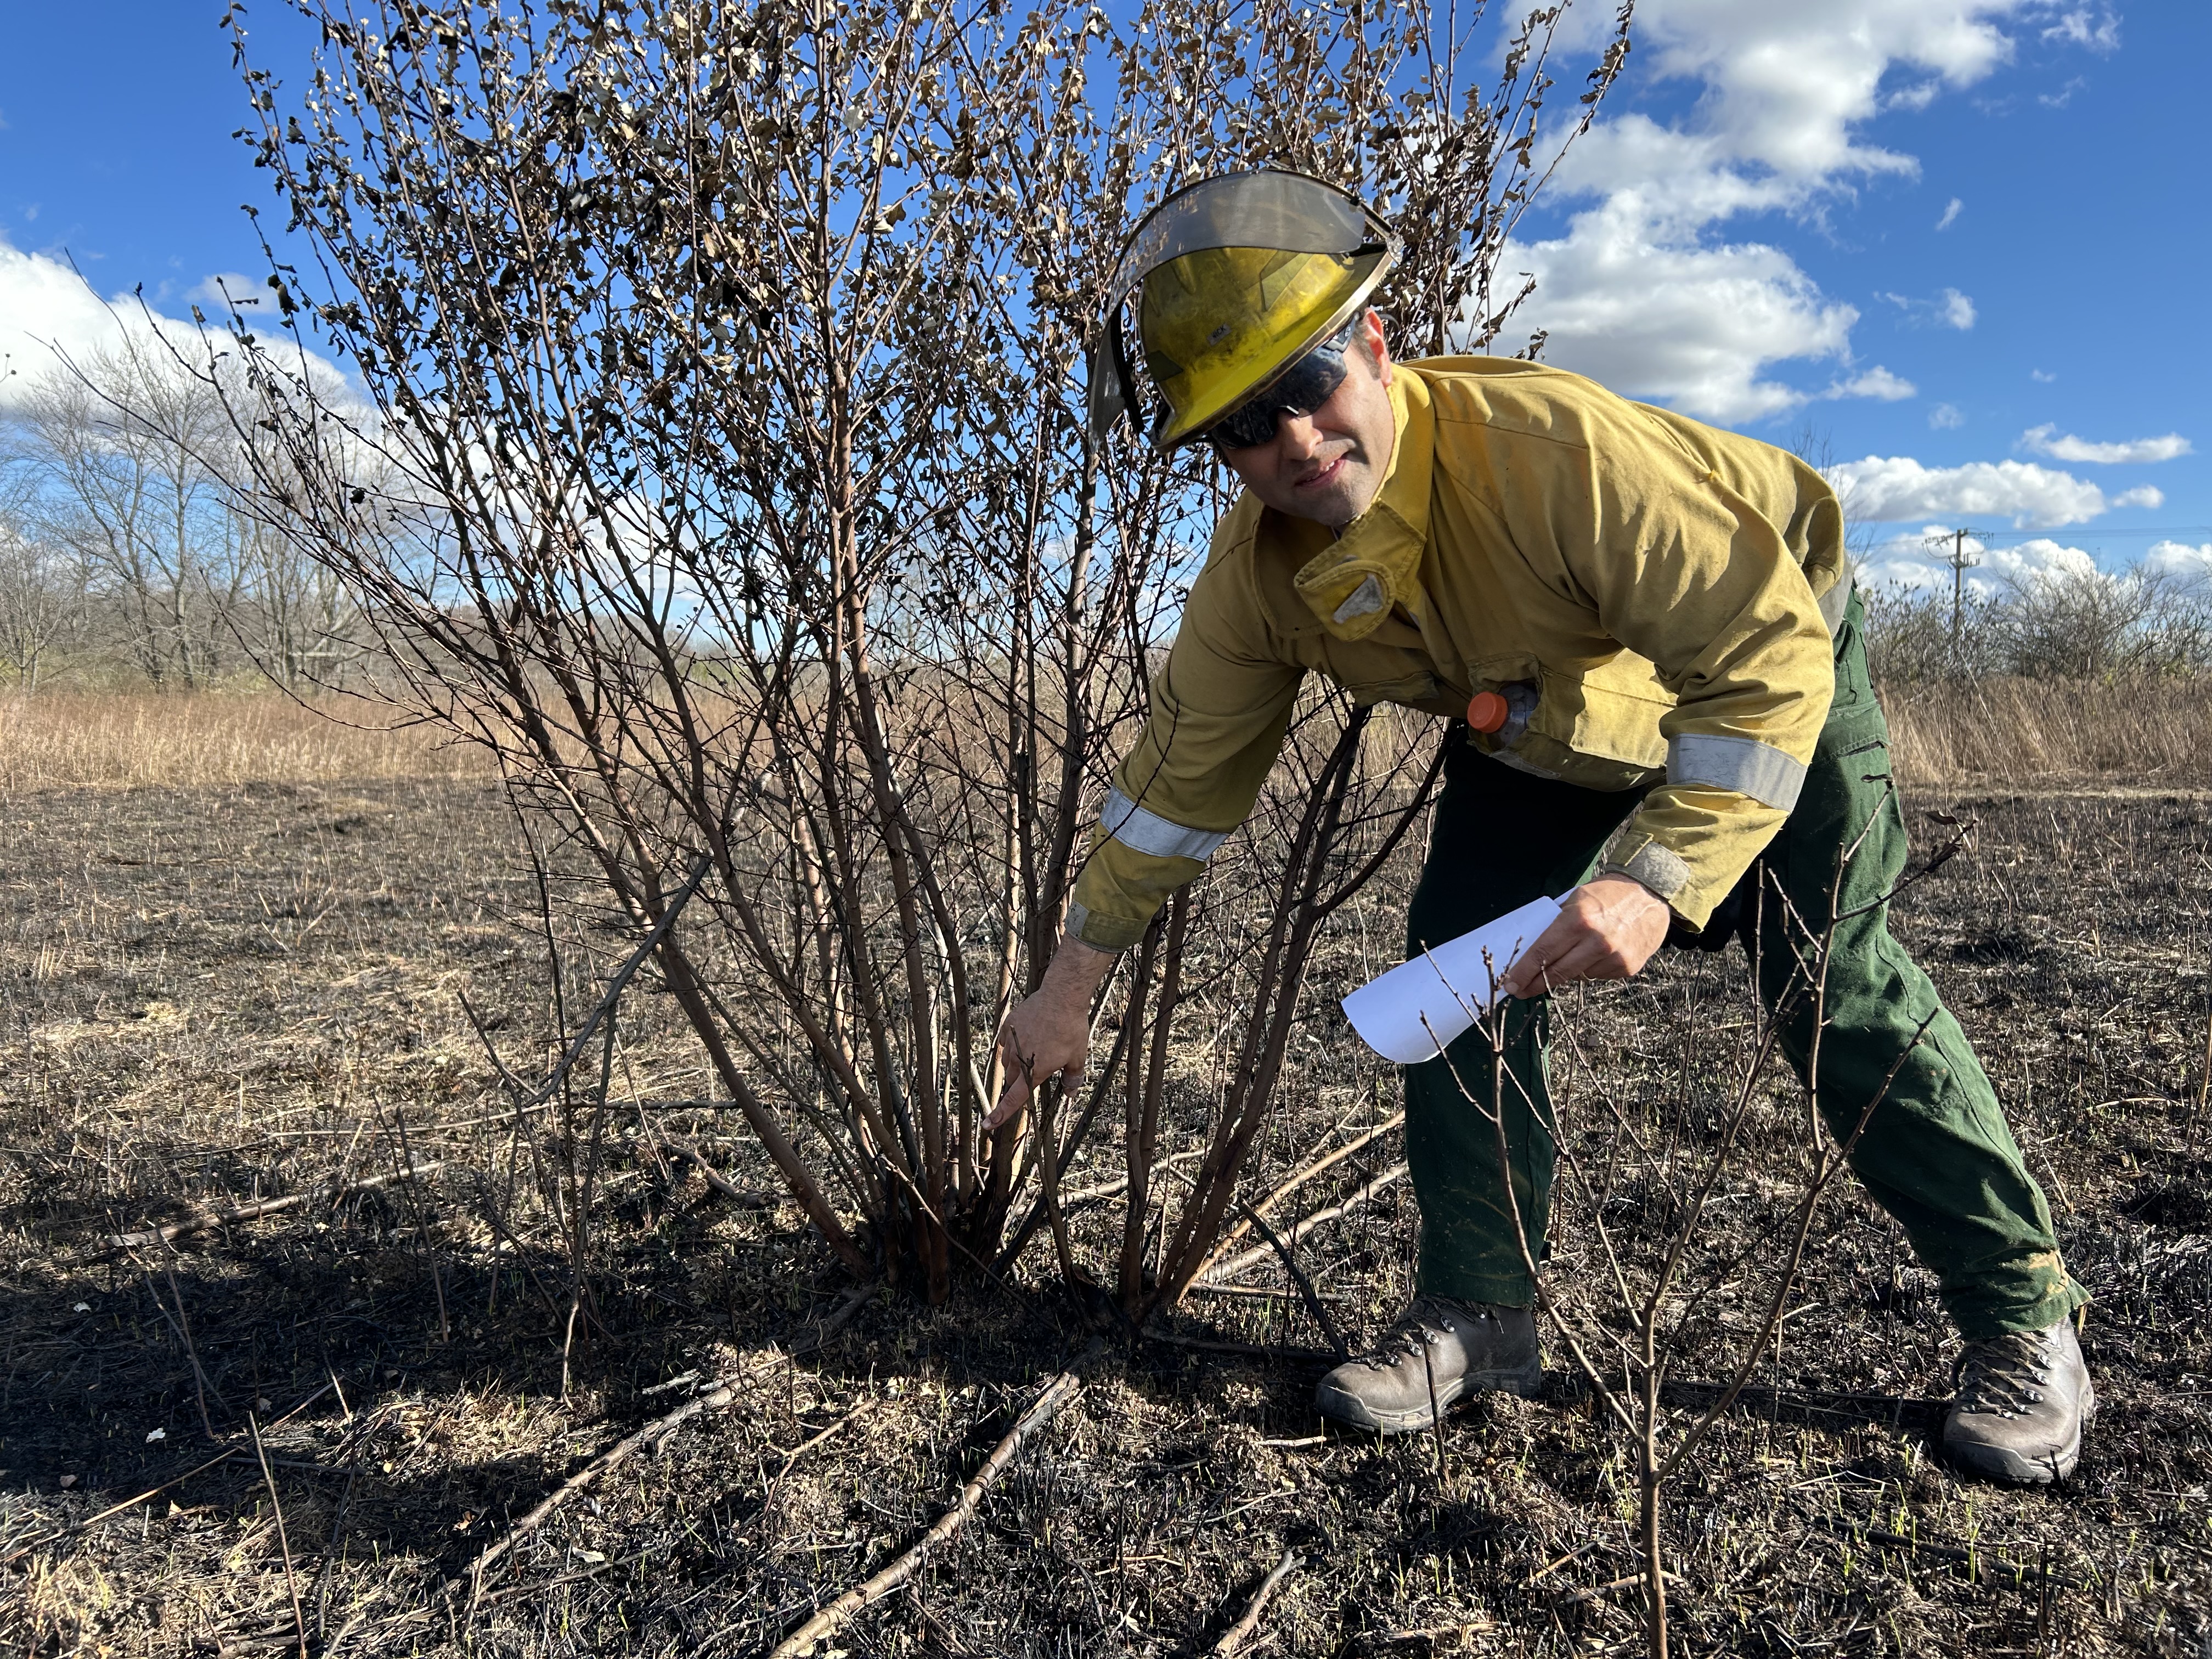
Ecologist Nick Budde, our prescribed fire coordinator, doing post-burn monitoring. Thanks to Nick for adapting the NPS categories and developing our burn monitoring protocol!
We try to do the burn monitoring reasonably soon after a burn is completed – if we wait too long then the vegetation can green up or leaves blow around which obscures the monitoring criteria. To make things efficient during a busy burn season, we can sometimes do the monitoring at the end of the burn while the rest of the crew is finishing mopping up or packing up equipment. If the burn days are too busy, we try to do the monitoring the next morning if we need to go back and see if any trees re-ignited on the firebreak or if any other fire hazards have developed. All it takes is a little extra professional discipline and time management to collect burn severity data and post-burn photos during the course of a burn season.
FPDWC Burn Severity Coding Matrix
Category 5 – Unburned
Category 4 – Scorched
Substrate: Litter partially blackened; wood/leaf structures unchanged at ground surface
Vegetation: Foliage of sedges/grasses partially blackened and attached to supporting stems or twigs; stems of forbs and small woodies unburned to lightly blackened at base
Category 3.5 – Patchily Lightly Burned
Substrate & vegetation: Roughly equal areas that are scorched and lightly burned
Category 3 – Lightly Burned
Substrate: Less than 30% bare soil; litter and moss charred to partially consumed, but some plant parts are still discernable; most small to medium woody debris is scorched; logs are unburned to scorched but not charred
Vegetation: Unconsumed vegetation of sedges/cool season grasses more than 1” high; most warm season grasses consumed to 3” tall or higher; most stems of forbs and small woodies scorched; some stems may still be standing
Category 2.5 – Lightly to Moderately Burned
Substrate: Litter and moss partially to mostly consumed; 30-80% bare dirt; most small to medium woody debris is scorched to partially consumed; most logs are scorched to charred
Vegetation: Unconsumed vegetation of sedges/cool season grasses less than 1” high; most forbs and warm season grasses consumed to less than 2” tall; most stems of small woodies scorched to partially consumed
Category 2 – Moderately Burned
Substrate: Litter fully consumed; 80-100% bare soil; most small to medium woody debris partially to mostly consumed; logs are deeply charred to mostly consumed
Vegetation: Sedges/cool season grasses fully consumed; most forbs and warm season grasses fully consumed; stems of small woodies partially to completely consumed
Category 1 – Heavily Burned
Substrate: Mineral soil visibly altered, often reddish; litter and duff completely consumed; even sound logs are deeply charred to completely consumed
Vegetation: All plant parts consumed leaving some or no major stems or trunks, any left are deeply charred; no unburned grasses above the root crown
We don’t use this category because our prescribed burns are not done under extreme (red flag) conditions and they have not resulted in these severe effects.
Fire Intensity Monitoring – Conclusion
In time, burn severity monitoring is giving us a standardized way to characterize the intensity of a burn. In combination with the seasonality and frequency of burning, it gives us a more nuanced way to assess how prescribed burns are affecting plant communities.
Prescribed burning is one of the ecological management activities that has higher risks to human and wildlife safety. That makes it important to make sure that the prescribed burns are meeting management objectives. It doesn’t take much extra time to assess the burn severity criteria outlined here, and to accumulate data to learn better how fire intensity can influence vegetation communities. No need to wait – start using a standardized protocol to monitor your fire’s effects during this burn season!
The Nature Conservancy is hiring for a full time permanent Restoration Ecologist. The job is open another two weeks. We are looking for someone who is a good person and has skills like these: Prescribed fire, chainsaw, skid loader, tractor, hauling such heavy equipment, weed work, seed harvesting. And on the soft skill side of things someone who wants to be a leader and mentor, can work with the public and colleagues. This link takes you to a list of job openings. Type Nachusa at top and it takes you there. Job number is 55855 if that helps. https://url.us.m.mimecastprotect.com/s/jsh6C9rAj8skm9EgECof6Hq_nAi?domain=careers.nature.org
The Friends of Nachusa Grasslands is hiring an Executive Director. This would be their first employee. They are an amazing set of citizens who are very productive. This would be a fun job for someone special. https://www.nachusagrasslands.org/executive-director.html
By Mike Saxton – Manager of Ecological Restoration and Land Stewardship at Shaw Nature Reserve
There are certain tools/pieces of equipment that once you have them, you wonder 1) why didn’t I buy this sooner? 2) how did we ever get by without this? I think a PTO driven blower for firebreak prep is one of those tools.
Here at Shaw Nature Reserve, we have 19 miles of hiking trails and gravel roads, many of which serve as firebreaks. Whether blowing mowed tallgrass and clearing leaves from trails, a PTO blower saves time and resources.
Our roads are 12ft wide gravel then a 3ft mowed green shoulder. We then do a fuel reduction line, mowing down tall grass prairie with a 5ft Woods mower deck. We blow the mowed debris into the unit. We have essentially a ~28ft wild break along our gravel roads. Pretty sweet! Blowing off the fuel reduction line isn’t critical but it sure feels good on a windy day with low Rh.
We have a few miles of woodland firebreaks. While we can blow them off in advance…we still have to make a return trip day-of to ensure the breaks are clean. More leaves always come down & high winds can move leaves back onto previously blown roads/trails. The morning of a burn can be hectic with loading equipment, checking and rechecking gear, making maps, etc. The ability to have 1 person head out on a tractor and clear/check miles of woodland fire break is a huge resource saver. It would take 2-4 people with backpack blowers to achieve what 1 person can do on a tractor.
Airflow is ~10,000 CFM (a nice Stihl backpack blower does about 900CFM at 195 mph)
Air speed is ~175 MPH (if you walk in front of it…it’ll blow your feet out from under you)
Requires 20 horsepower at the PTO
The cone rotates 360 degrees with an electric switch. But you have to throttle all the way down in order to overcome the force of the wind to turn the cone with the electric motor.
The unit is long which can make slaloming through trees difficult. It’s tricky when going over really uneven terrain because it’s so long and thus easy to bottom out.
The fall purple leaves of gray dogwood show in a patch mowed one time in 1994
On a recent blogpost I mentioned that I mowed a gray dogwood patch, Cornus racemosa, in about 1994, so 3 decades back. I only mowed it one time with a rotary mower on the back of a tractor. The dogwood clone had stalks about six feet tall. Since then we have been frequently burning this unit to keep various brush in check. It appears that those fires kept top killing the dogwood where it would re-sprout again as is shows in these current photos.
If we had time on our hands, we could treat each stem with basal bark herbicide but this low patch seems ok to me, with various grasses and forbs intermixing with it.
The recent GRN workshop was all tour based, with 5 themed tours that ran concurrently every two hours over two days. All participants could go on all 5 tours. I led the tour with the theme of weeds. We covered a lot of ground in footsteps and concepts.
Birdsfoot trefoil: We stopped at a unit with a 40 year history of invasive birdsfoot trefoil, Lotus corniculatus. The trefoil was planted for pasture forage and then later the pasture became part of Nachusa. We have experienced the long duration of the seed bank of these legumes as they continue to emerge. We have reduced their occurrence with about 15 years of careful backpack spraying and the field looks good at this time of year with only a few trefoil plants encountered as we hiked around.
The last two seasons we have tried boom spraying a pre-emergent herbicide, Esplanade 200, on the prairie planting in early spring. This kills all seeds emerging, good and bad, but it gives our weed crew a chance to catch up with the adult trefoil plants. This shows signs of success as the field looks better than ever, but we will report out later.
Selfie by Bill
Reed canary grass: We looked at a wet meadow that once was thick with reed canary grass, Phalaris arundinacea, and is now much reduced in reed canary grass and dominated by native plants. We used grass herbicides intensively for several years from about 1993 to 1998 and then were able to spray with just backpacks with occasional tractor spot spraying since.
Sweet clover: We found that mowing about the 4th of July proved very effective on white sweet clover, with yellow sweet clover mowed a week or two before the white. Here is a recent post on that: https://grasslandrestorationnetwork.org/2024/07/11/yellow-and-white-sweet-clover/ On the GRN blogsite there is a search bar. There are four articles on sweet clover on the site.
Lespedeza daurica and L. cuneata: These invasive legumes take a lot of work to control. We talked about the need for careful sweeping, this refers to walking back and forth across a planting. We also agreed that at least two visits per year are needed, and three would be best to get towards success. Here are a few posts on that:
Photo from the workshop, the editors of this blogsite: Julianne Mason, Mike Saxton, and Bill Kleiman
Exotic vs Invasive: I listed some species of exotic plants that I don’t think are invasive in our area: Queen Anne’s lace, dames rocket, canada thistle, garlic mustard (as frequent fire controls mustard). I also spoke of holding back on planting the native shrub Amorpha bush, Amorpha fruticosa, as I have seen it get very dense in a new planting. Gray dogwood has been controlled with one or two mowings.