We have been using ESRI’s Field Maps app on our cell phones for natural resource management and monitoring data collection, and LOVING IT! For ecological management data, we have data layers and maps for invasive species treatments and observations, seed collection areas, native seed/plugs/woodies planted (areas and associated lists), prescribed burns, and deer culling. For monitoring data, we have wildlife, plant, and invertebrate observations, photo point monitoring, rare plant monitoring, turtle tracking data, small mammal trapping data, grassland bird monitoring, deer census data, and various other data sets. I absolutely love having so much good, organized, easily accessible ecological management information riding around in my pocket while I’m out in our preserves.
When was the last time this area was burned? … What did we seed here and when (species and seeding rates)? … When was the last time xxx species was observed here? … Where are the endangered turtles brumating? …
It’s great to have easy access to all this information in the field, and I think it helps us to make better, more informed decisions as ecologists and natural resource managers.

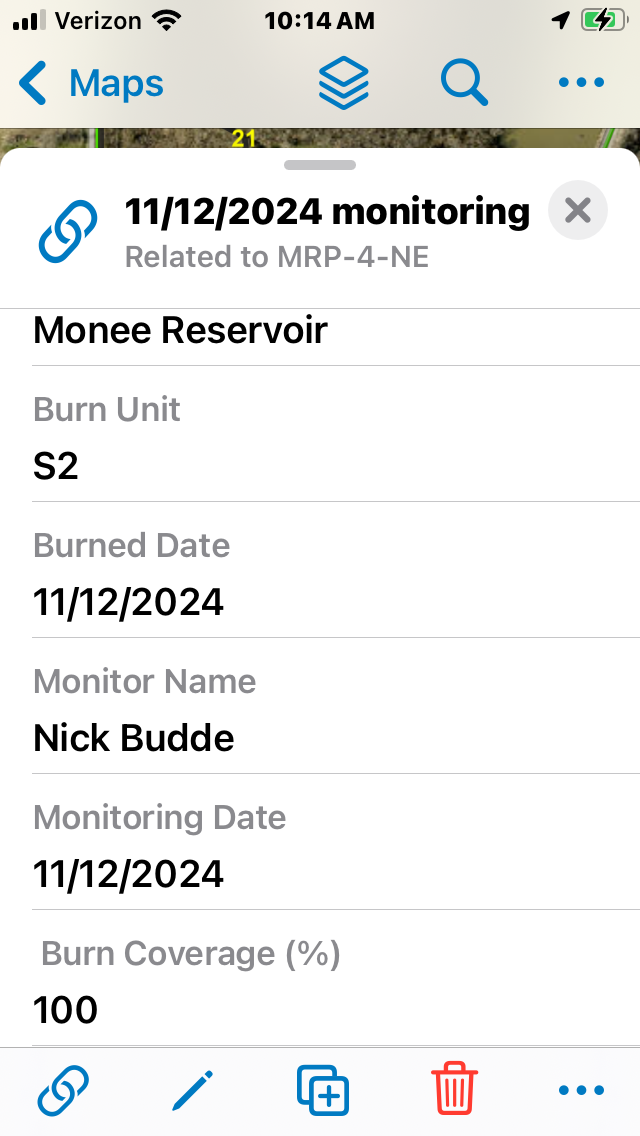
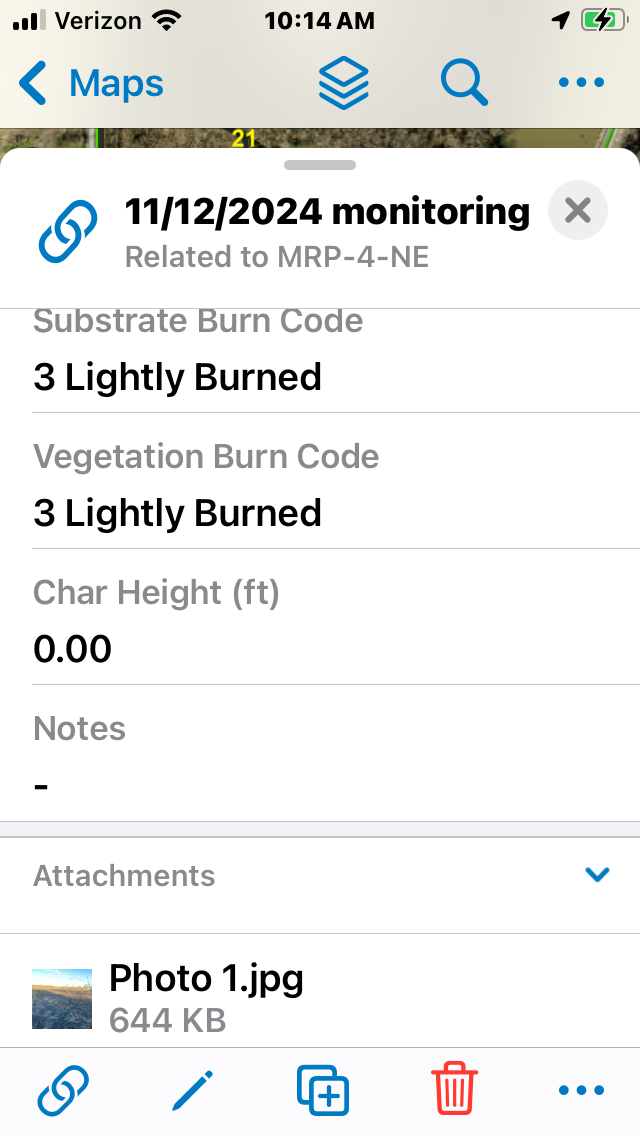
As I mentioned in the first part of the post on prescribed burn monitoring, we have been using the Field Maps app to easily collect burn severity monitoring data as well as to document our prescribed burns. We collect the burn severity data from our permanent photo point locations. These permanent photo points are part of our rapid assessment vegetation monitoring, which tracks plant community changes over time. In the GIS structure, the burn monitoring table is related to the photo point locations.
When we add burn monitoring data, we use pre-established drop downs to select the appropriate fire severity category and enter values for burn coverage and char height. Then, we take a photo through the app which links to that monitoring event and photo point location. It’s very user-friendly and fast!

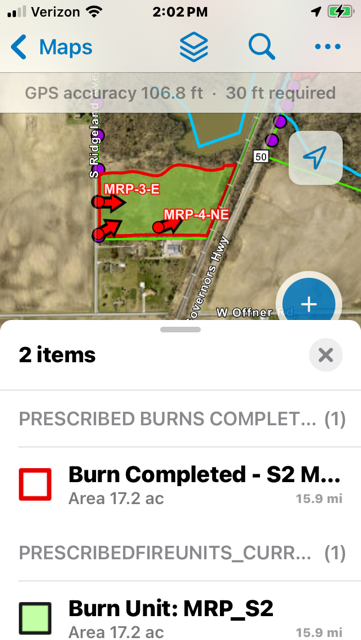
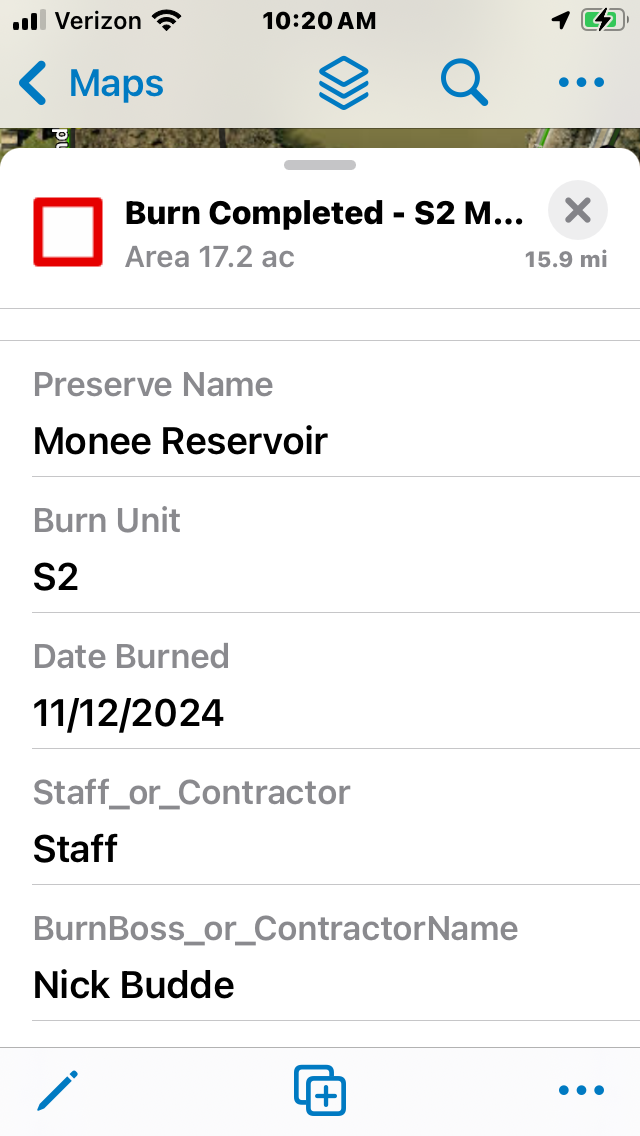
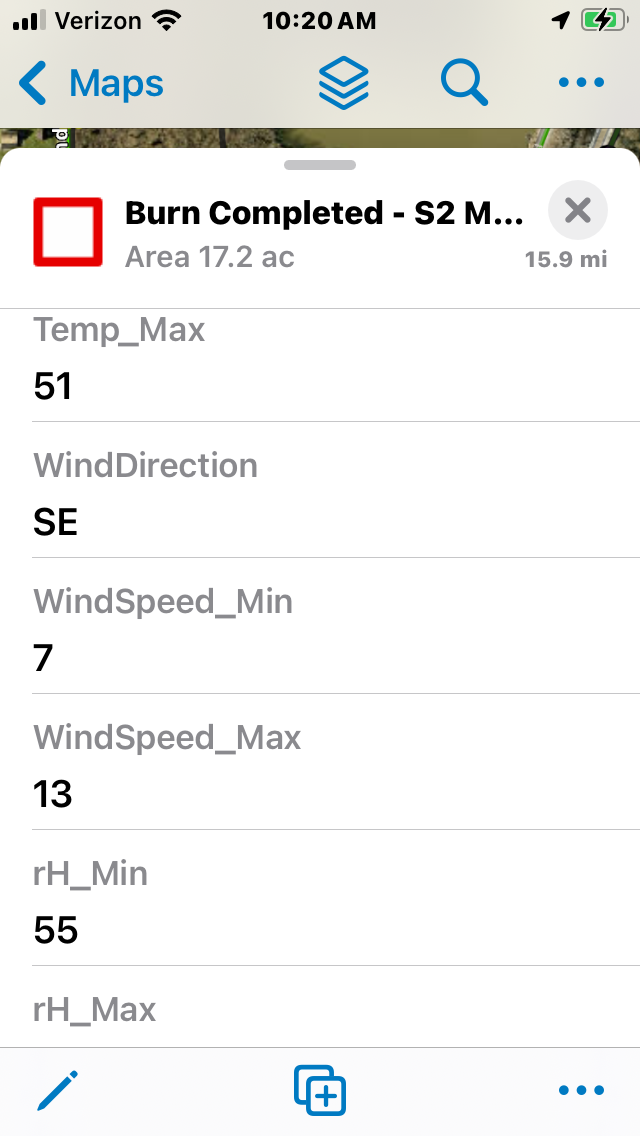
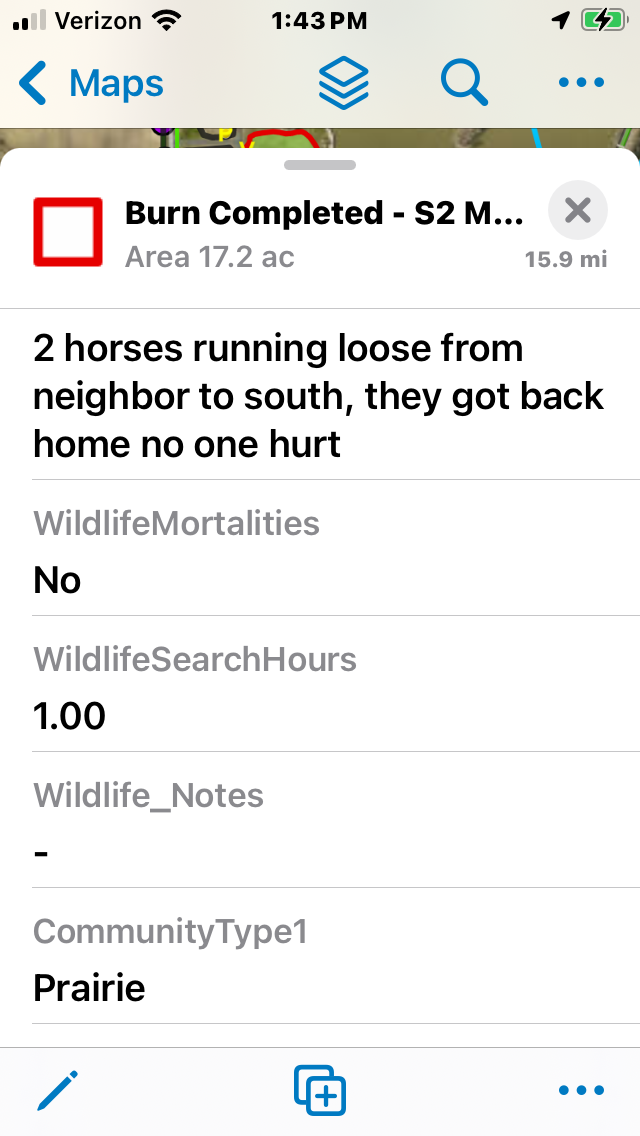
We also use Field Maps to document our prescribed burns completed. We can either copy the shape of an existing burn unit, or drawn in a new polygon to depict the area burned, and then enter information about the burn using the app. Our burn report includes basic data about the burn (e.g., unit name, date burned, burn boss name), weather data (e.g., temp, wind speed and direction, relative humidity, days since last precip), burn implementation data (crew size, start and end times, notes), wildlife mortalities and search effort, and fire effects (community type, flame lengths, percent burned, notes).


In addition to using Field Maps for burn data collection, we have the following reference information loaded into our burn maps: burn notifications (contact names, agencies, phone numbers), fire districts, fire station locations, utility poles, pipeline locations, hazard locations, deer stand locations, fire break locations and status, way point locations, brush pile locations, prior burn history, preserve boundaries, trails, and waterway locations. So much great information!! My personal favorite is that I can tap on a dispatch phone number at the end of a long burn day when my eyes are full of smoke and not working well, and it automatically calls the number without me having to (mis)dial it! Yes, we are absolutely loving using Field Maps for prescribed burns.


Like any good system for data collection, it’s key to have a well structured and organized framework. Our data framework started with geodatabases created in ArcMap/ ArcPro that were published to ArcGIS online and then configured for field data entry. Field Maps makes the interface for configuring and using it in the field intuitive and easy. Our specific data categories, drop down lists, and information collected may not be precisely applicable to your organization, but in Field Maps they can be customized to meet your needs. I highly recommend using Field Maps to enter and access prescribed burn information!

I don’t know if this applies to your version of Field Maps, but one caveat is that cellphone apps in general, unlike expensive professional software, can crash in the middle of data gathering due to poor design, conflicts with other software on the phone, etc. If the app requires online login or uses cloud storage, that’s another potential failure point. Before entering lots of priceless data, the user should ensure that their entire database can be stored on their local device & the data can be easily backed up to a different device & to the cloud. Or that the mobile device acts as a field terminal to a main database, which is stored on the user’s computer & is regularly backed up to a different device & the cloud. Hardware & cloud storage can fail at any time, so the user must have a regularly updated backup that they fully control. That backup should be checked monthly to make sure it’s available when you most need it.
Hi Don, the Field Maps app is a field interface to the main database(s) stored on ArcGIS online. We do regularly download a copy of the ArcGIS online data (which is on the Cloud) to our local servers as a backup. However, I’m happy to report that we haven’t had a single instance of data loss or needed to access the backup data in the six years that we’ve been using the digital system. We used to have a lot more issues with lost data sheets or ones that were soaked, muddy, sooty, or unreadable back when we were using paper data sheets!