Part 1 – Fire Intensity Monitoring Protocol
I know, I know. There’s a lot to do during prescribed burn season and monitoring typically isn’t high on the list of pressing priorities. However, I would like to make the case that prescribed burn monitoring doesn’t have to take up much additional time, and the data is well worth the small amount of additional effort!
The ecological effects of prescribed burns can vary a lot depending on seasonality, frequency, and fire intensity. Seasonality and frequency are pretty straightforward to track over time by just recording the dates and areas burned. Fire intensity is more complicated to infer since it is affected by many factors like weather conditions (relative humidity, temperature, wind speed), fuel moisture levels, fuel model type (grassland vs woodland), and firing techniques (backing, flanking, or headfires).


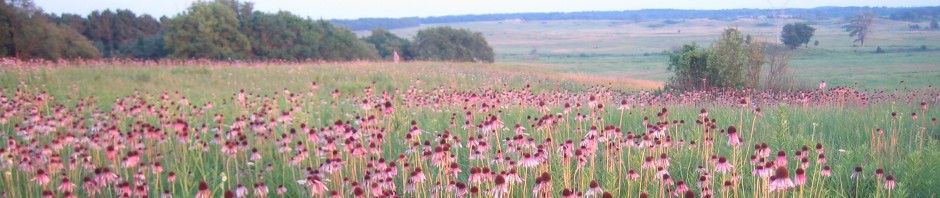
We have a network of photo monitoring points that we use to track plant community changes through time. Basically, we have GPS points and just go back to the same locations every few years to take photos facing in a standardized direction. Simple, right?

For the past eight years or so, we have been using a greatly simplified version of the National Park Service’s Fire Monitoring Handbook protocol to assess burn severity. If you don’t want to read their whole protocol, just jump to page 110. Our version of burn severity monitoring is as follows.
- Take post-burn photos at each permanent photo point monitoring location in the burned unit.
- At each monitoring location, walk 5 meters in the direction that the photo was taken. Within a 3 m radius, record the percent burn coverage.
- Assess the burn severity category for the substrate layer (duff/leaf litter) and vegetation layers using the categories below (this is our modification of the NPS categories).
- The maximum char height is averaged for the nearest three woodies and recorded.
- We use the ESRI Field Maps app to take the photos and enter the data into a geodatabase. Easy-peasy!


We try to do the burn monitoring reasonably soon after a burn is completed – if we wait too long then the vegetation can green up or leaves blow around which obscures the monitoring criteria. To make things efficient during a busy burn season, we can sometimes do the monitoring at the end of the burn while the rest of the crew is finishing mopping up or packing up equipment. If the burn days are too busy, we try to do the monitoring the next morning if we need to go back and see if any trees re-ignited on the firebreak or if any other fire hazards have developed. All it takes is a little extra professional discipline and time management to collect burn severity data and post-burn photos during the course of a burn season.
FPDWC Burn Severity Coding Matrix
Category 5 – Unburned
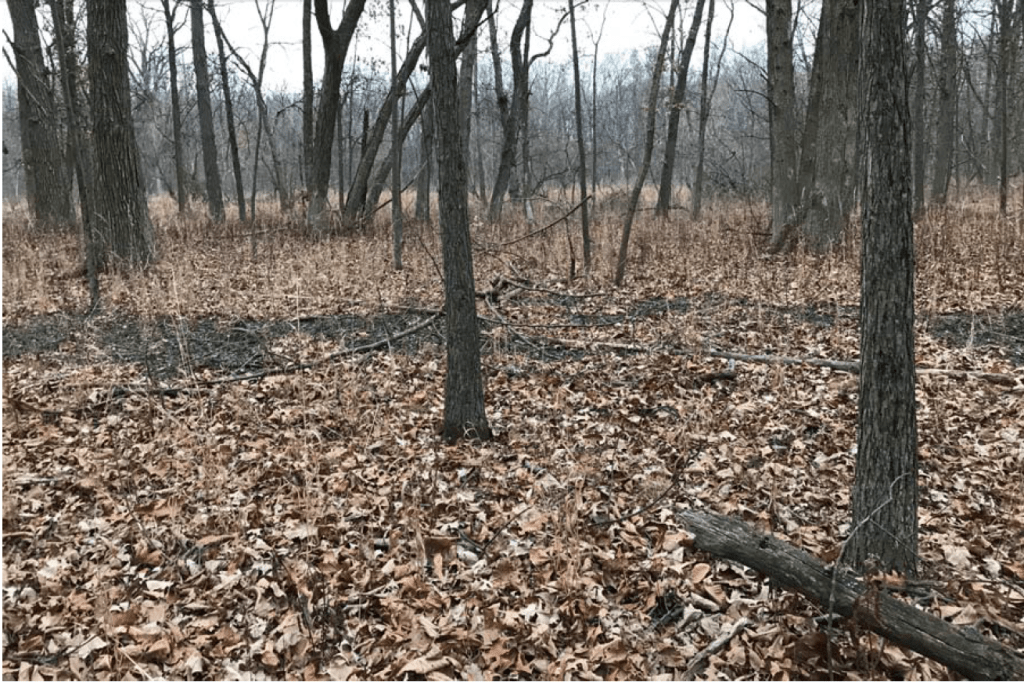
Category 4 – Scorched
- Substrate: Litter partially blackened; wood/leaf structures unchanged at ground surface
- Vegetation: Foliage of sedges/grasses partially blackened and attached to supporting stems or twigs; stems of forbs and small woodies unburned to lightly blackened at base
Category 3.5 – Patchily Lightly Burned
- Substrate & vegetation: Roughly equal areas that are scorched and lightly burned
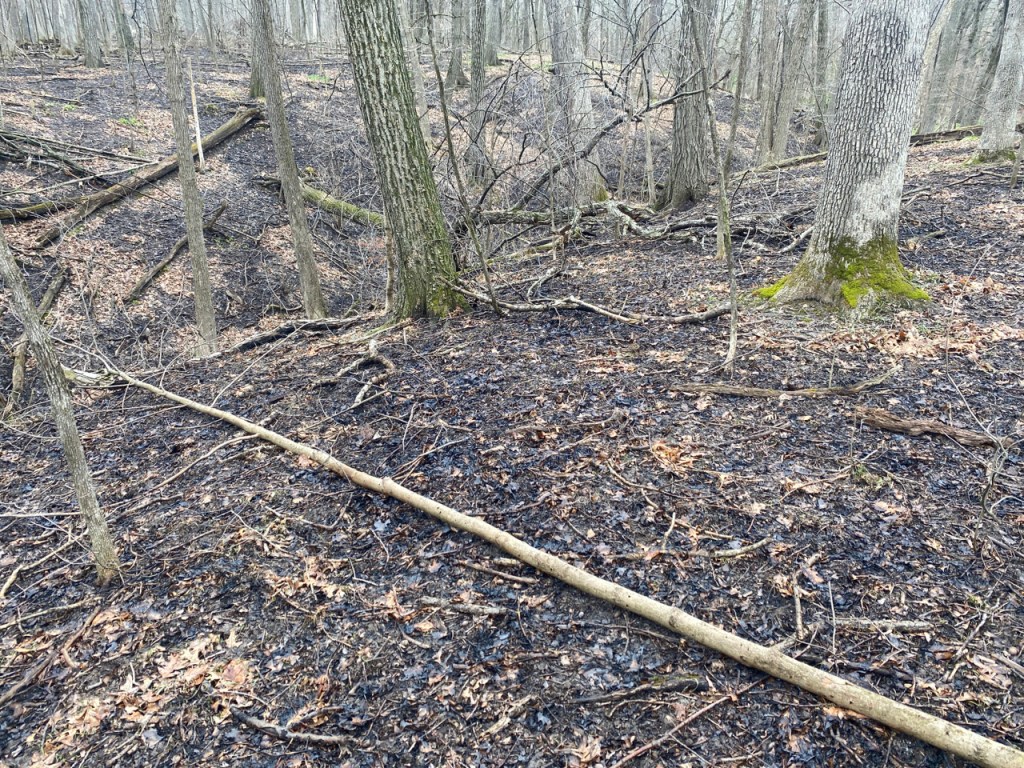
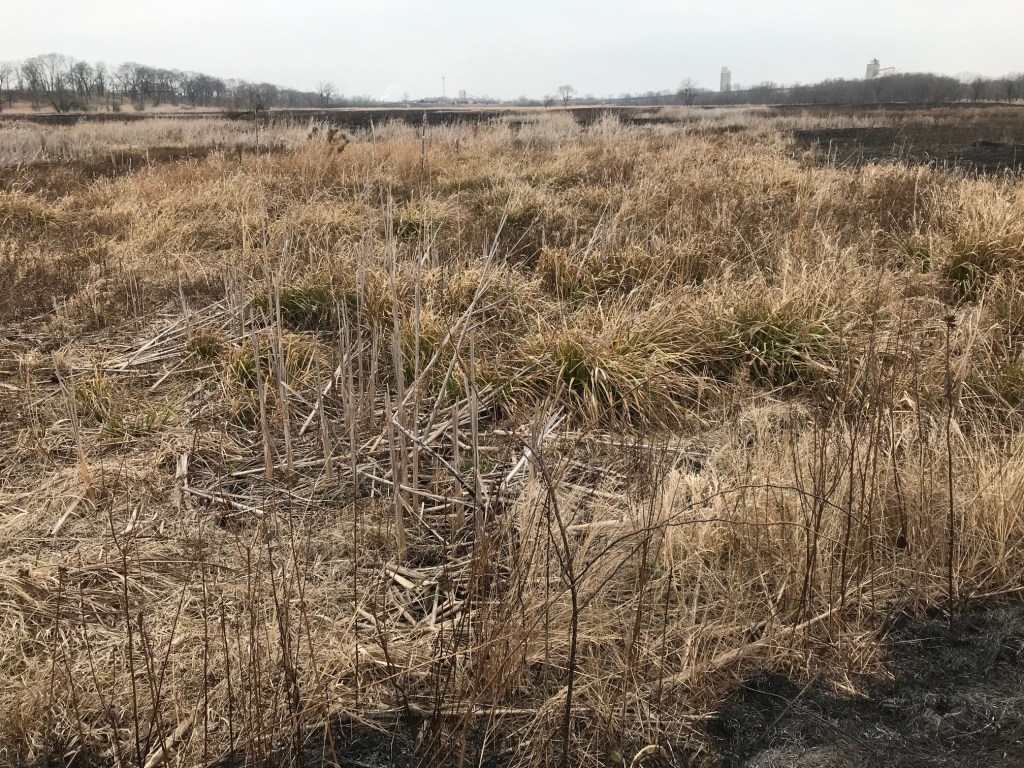
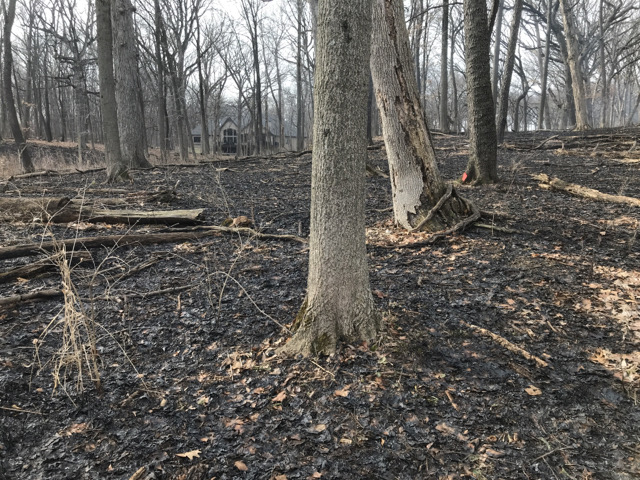
Category 3 – Lightly Burned
- Substrate: Less than 30% bare soil; litter and moss charred to partially consumed, but some plant parts are still discernable; most small to medium woody debris is scorched; logs are unburned to scorched but not charred
- Vegetation: Unconsumed vegetation of sedges/cool season grasses more than 1” high; most warm season grasses consumed to 3” tall or higher; most stems of forbs and small woodies scorched; some stems may still be standing
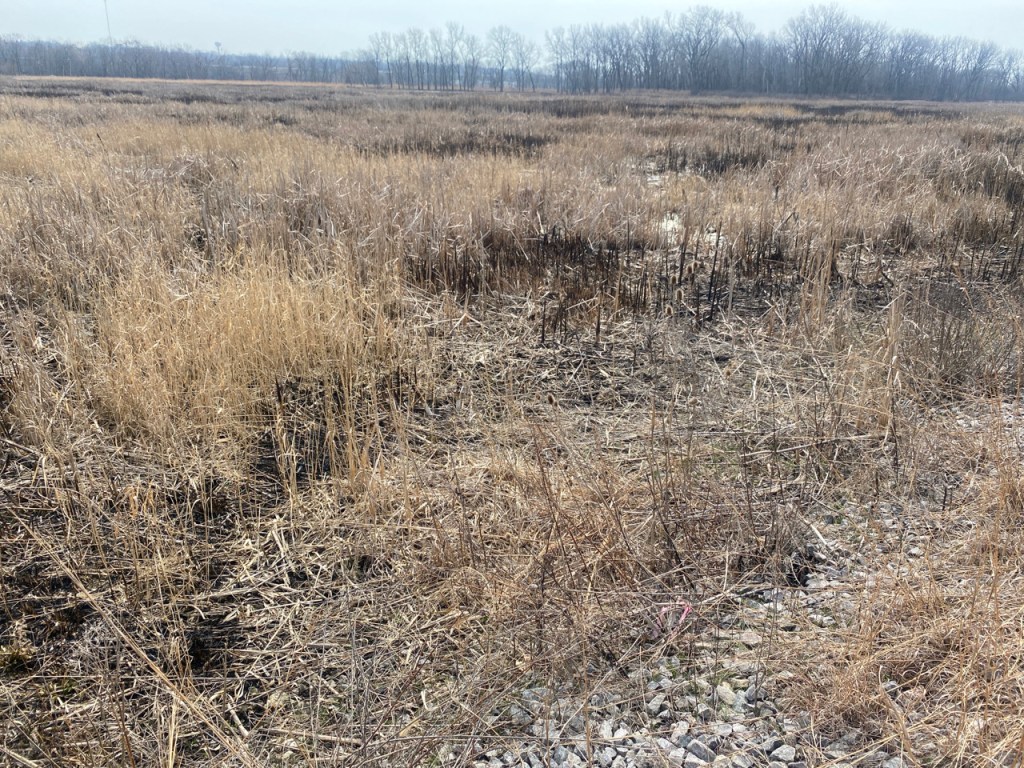
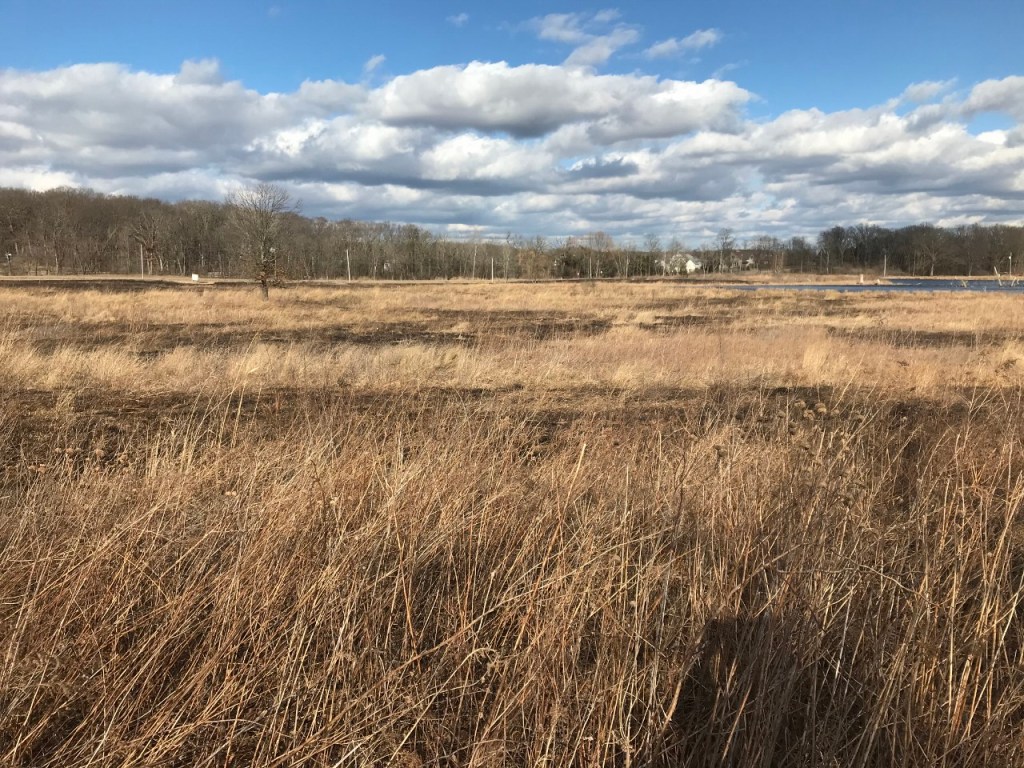
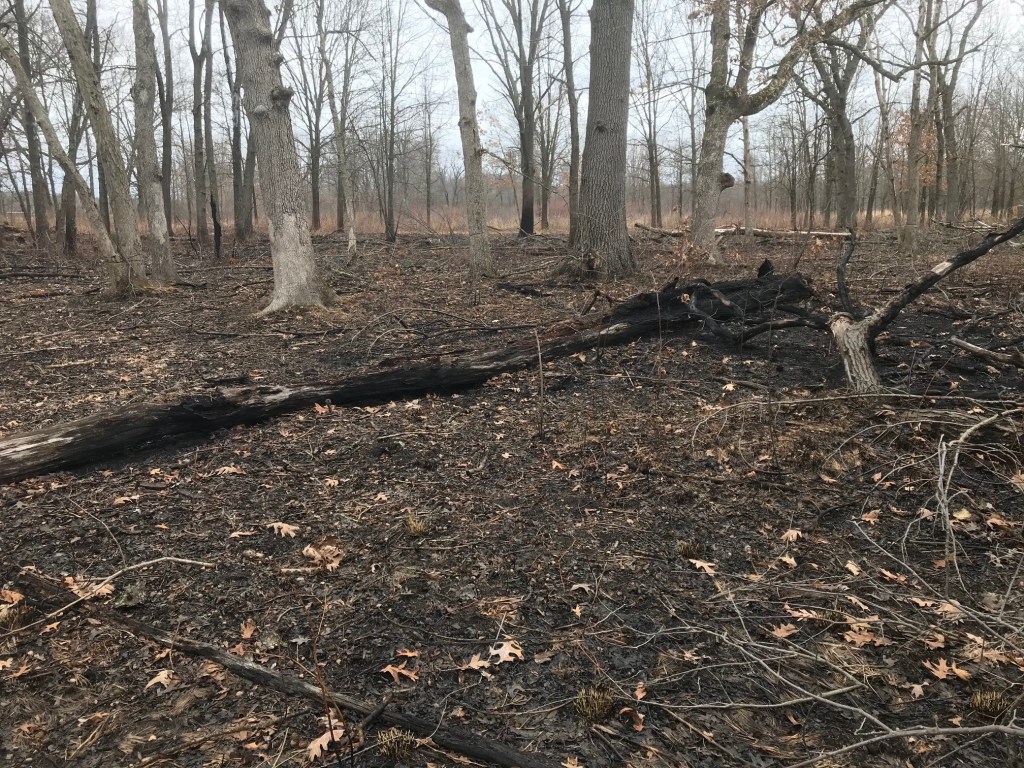
Category 2.5 – Lightly to Moderately Burned
- Substrate: Litter and moss partially to mostly consumed; 30-80% bare dirt; most small to medium woody debris is scorched to partially consumed; most logs are scorched to charred
- Vegetation: Unconsumed vegetation of sedges/cool season grasses less than 1” high; most forbs and warm season grasses consumed to less than 2” tall; most stems of small woodies scorched to partially consumed
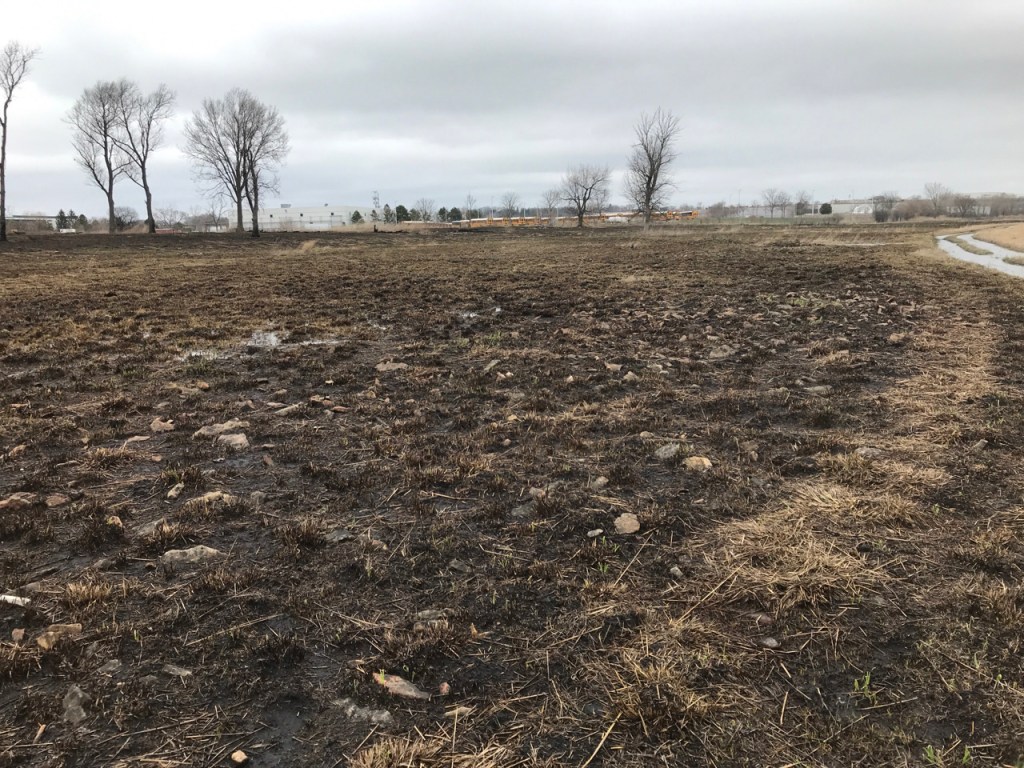
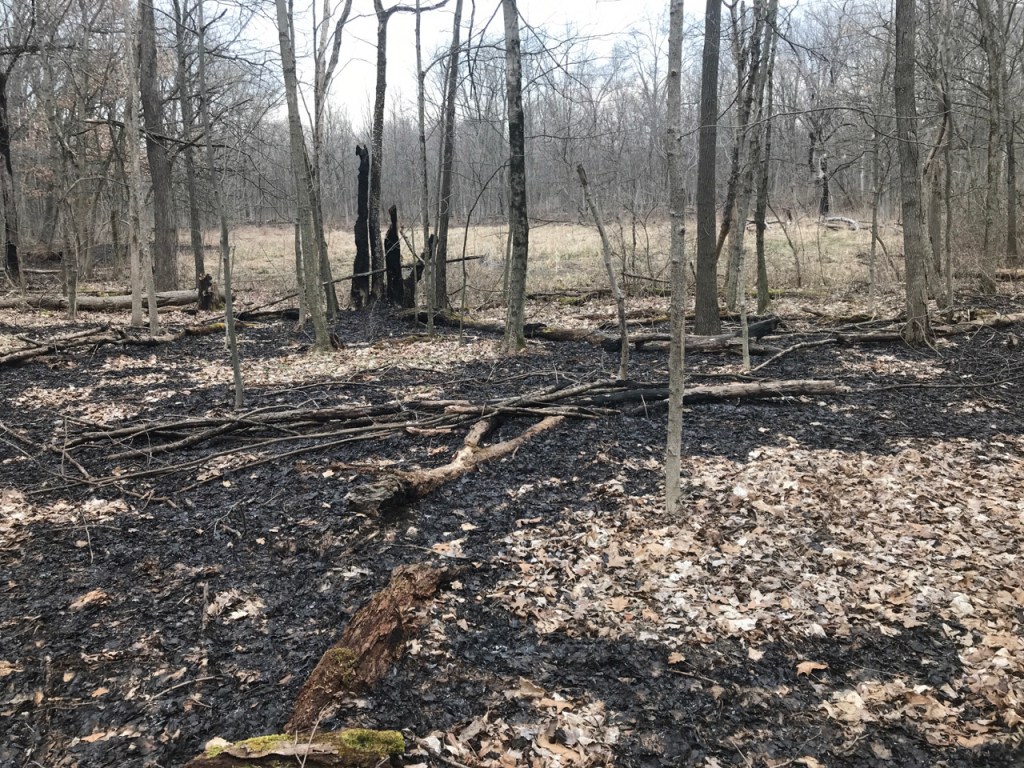
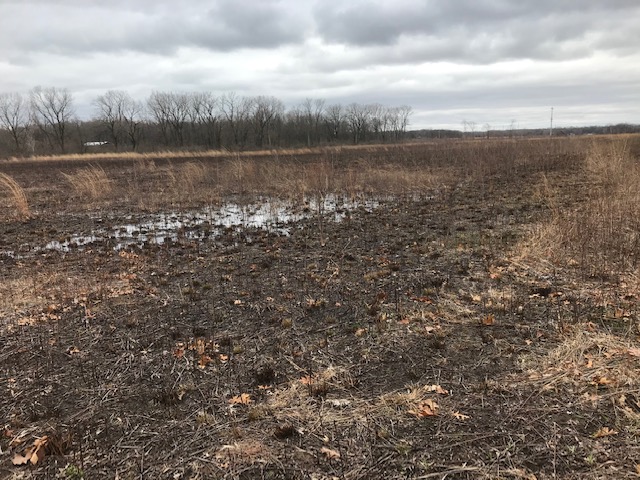
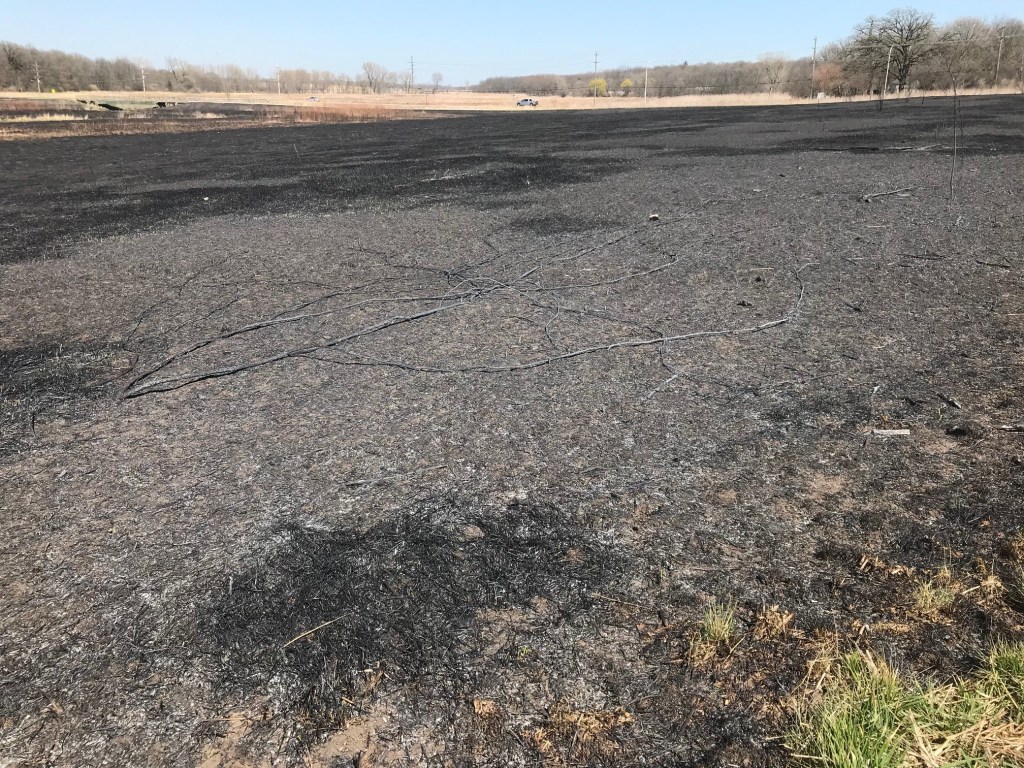
Category 2 – Moderately Burned
- Substrate: Litter fully consumed; 80-100% bare soil; most small to medium woody debris partially to mostly consumed; logs are deeply charred to mostly consumed
- Vegetation: Sedges/cool season grasses fully consumed; most forbs and warm season grasses fully consumed; stems of small woodies partially to completely consumed
Category 1 – Heavily Burned
- Substrate: Mineral soil visibly altered, often reddish; litter and duff completely consumed; even sound logs are deeply charred to completely consumed
- Vegetation: All plant parts consumed leaving some or no major stems or trunks, any left are deeply charred; no unburned grasses above the root crown
- We don’t use this category because our prescribed burns are not done under extreme (red flag) conditions and they have not resulted in these severe effects.
Fire Intensity Monitoring – Conclusion
In time, burn severity monitoring is giving us a standardized way to characterize the intensity of a burn. In combination with the seasonality and frequency of burning, it gives us a more nuanced way to assess how prescribed burns are affecting plant communities.
Prescribed burning is one of the ecological management activities that has higher risks to human and wildlife safety. That makes it important to make sure that the prescribed burns are meeting management objectives. It doesn’t take much extra time to assess the burn severity criteria outlined here, and to accumulate data to learn better how fire intensity can influence vegetation communities. No need to wait – start using a standardized protocol to monitor your fire’s effects during this burn season!

Great post, Juli. Thank you for sharing.
Pingback: Prescribed Burn Monitoring – Fire Intensity and Vegetation Community Changes | grassland restoration network